
milestone 1: initial paper sketches
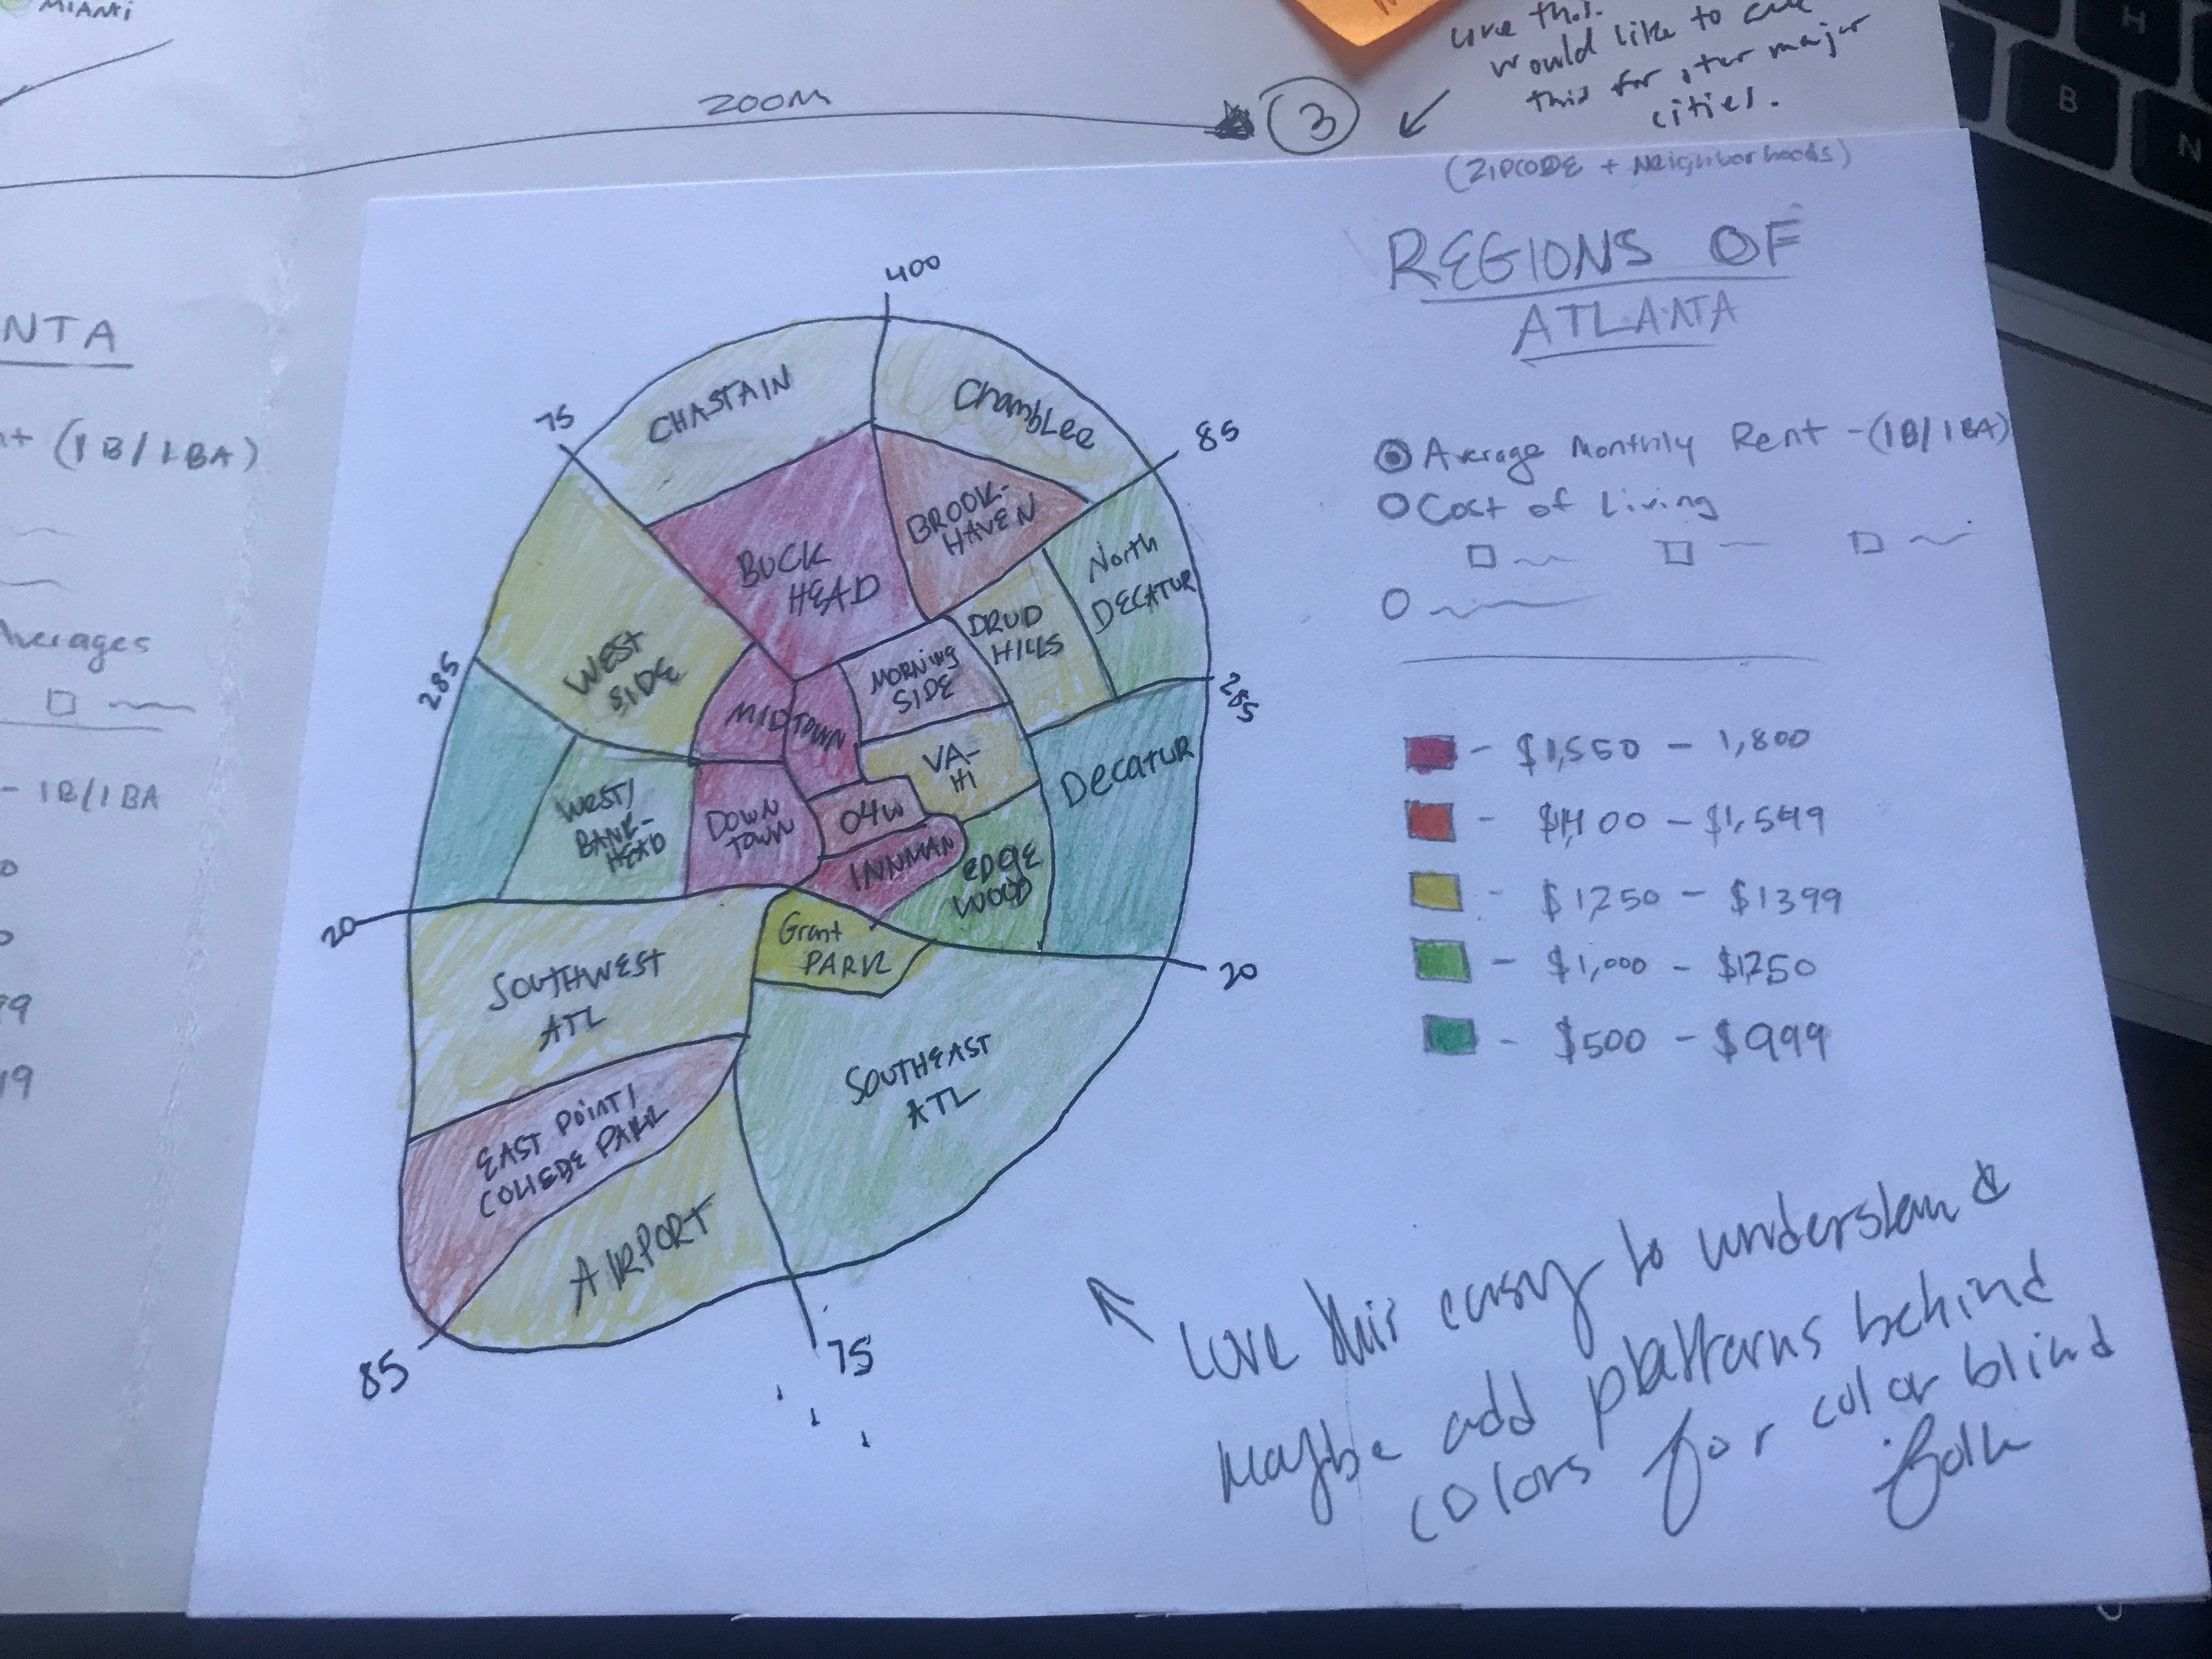
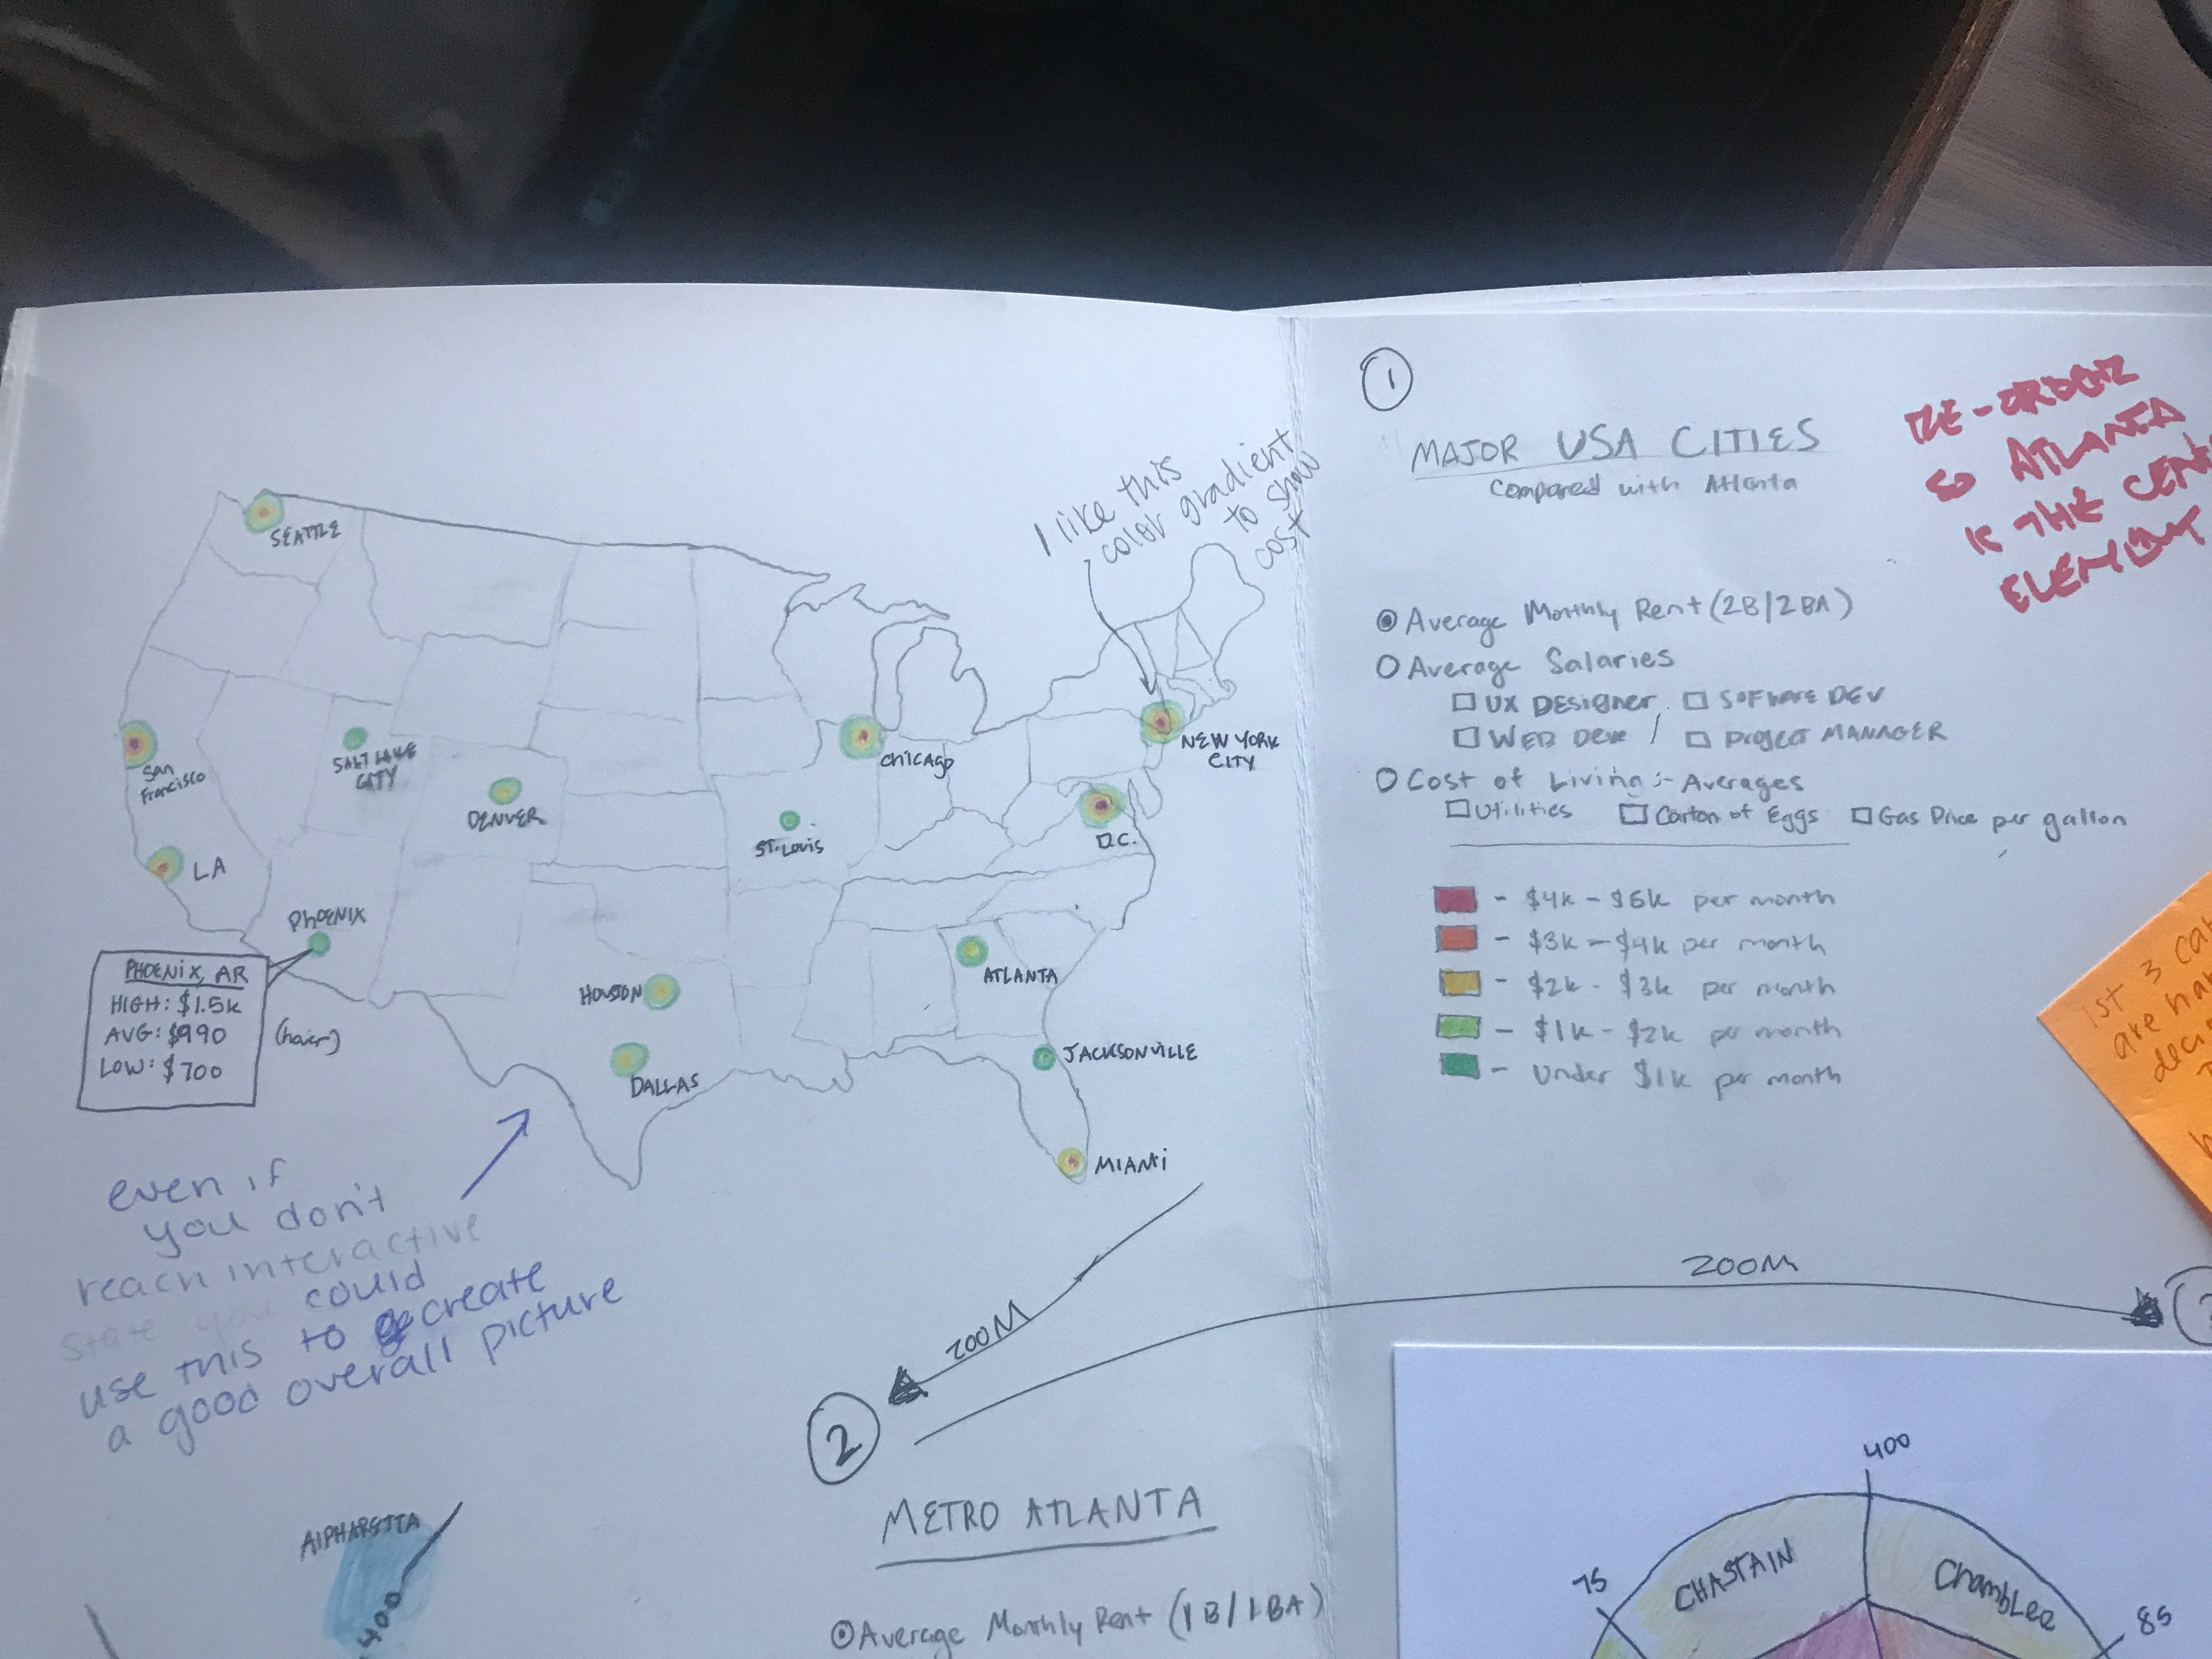
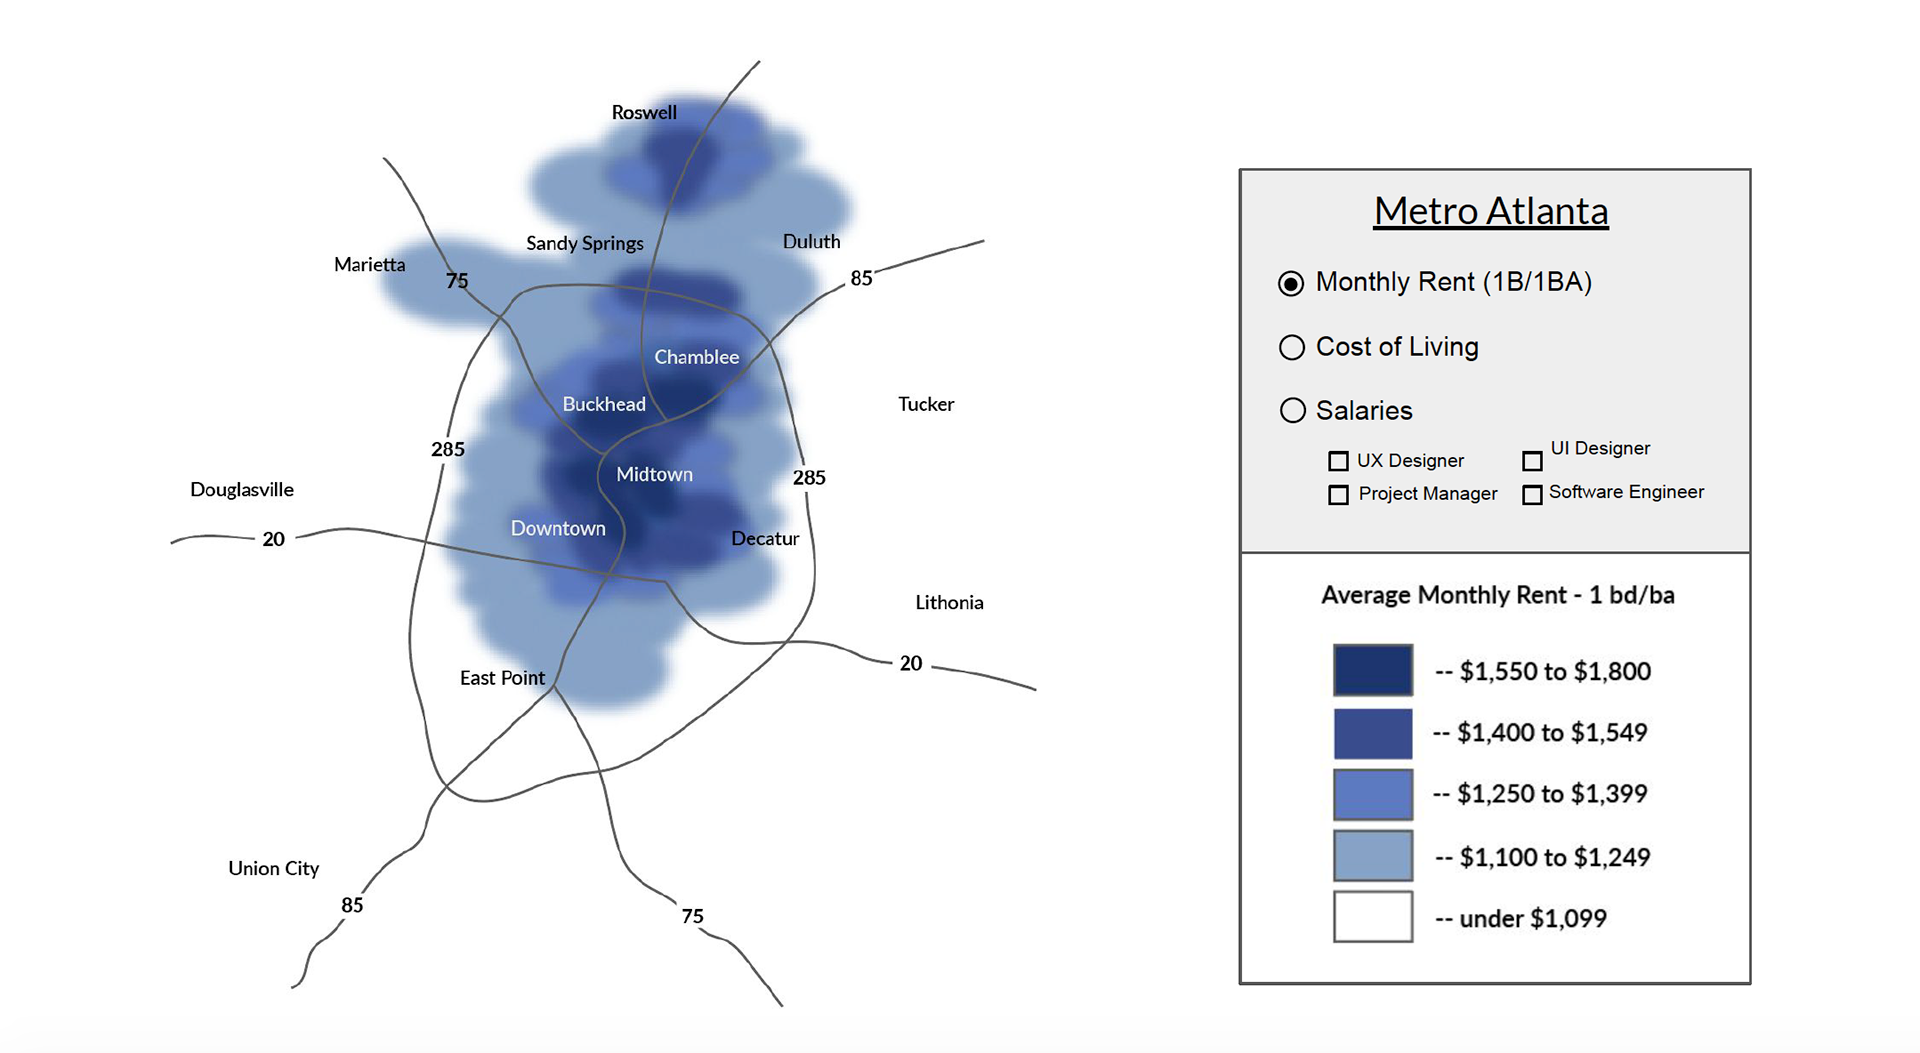
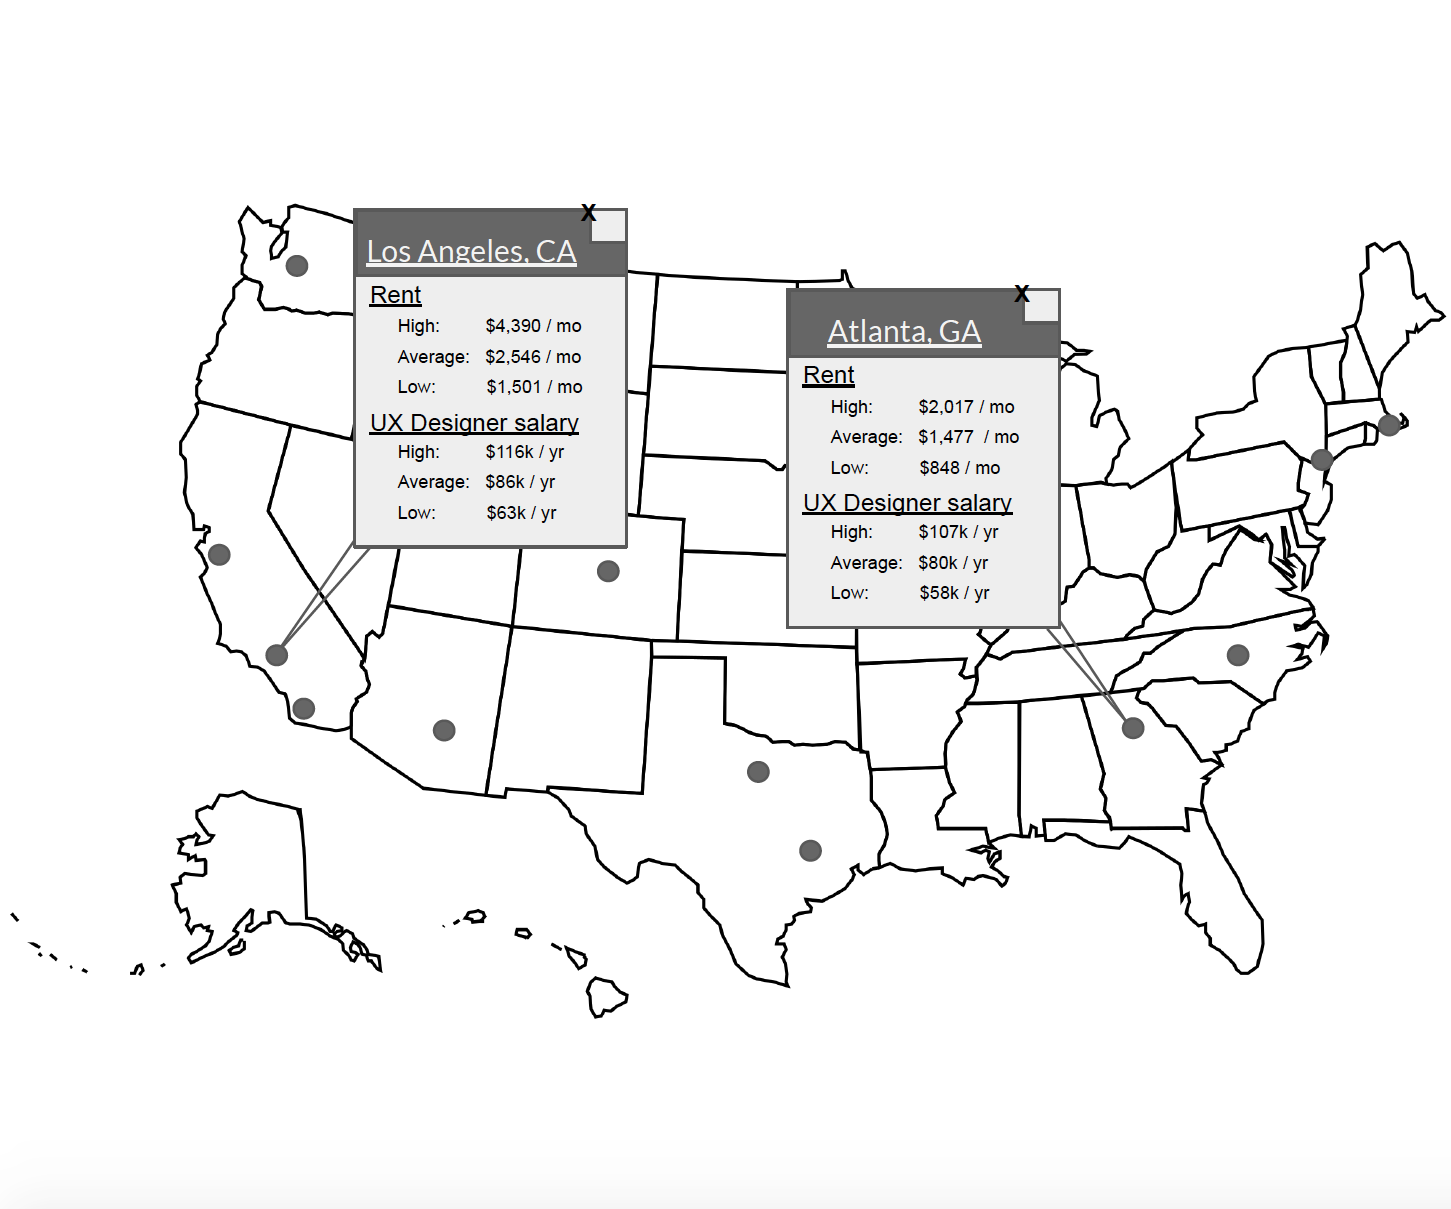
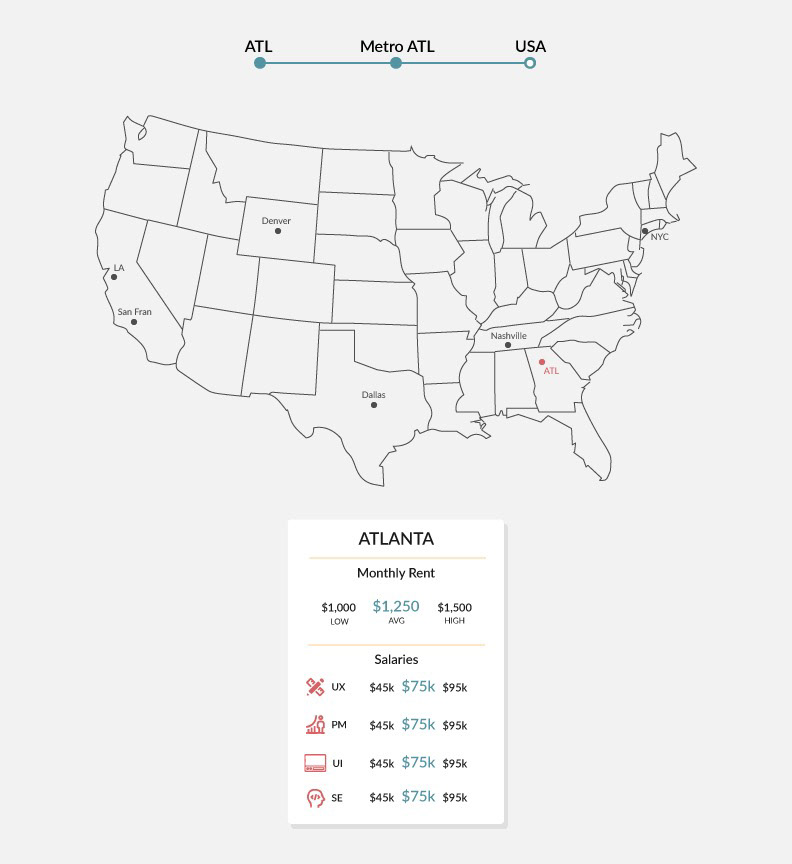
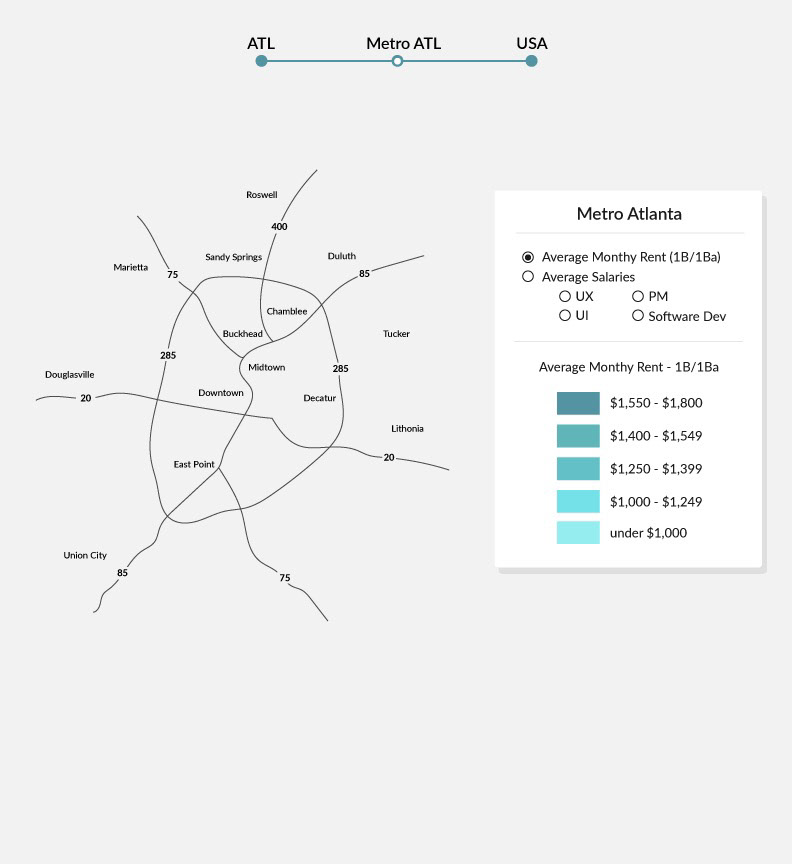
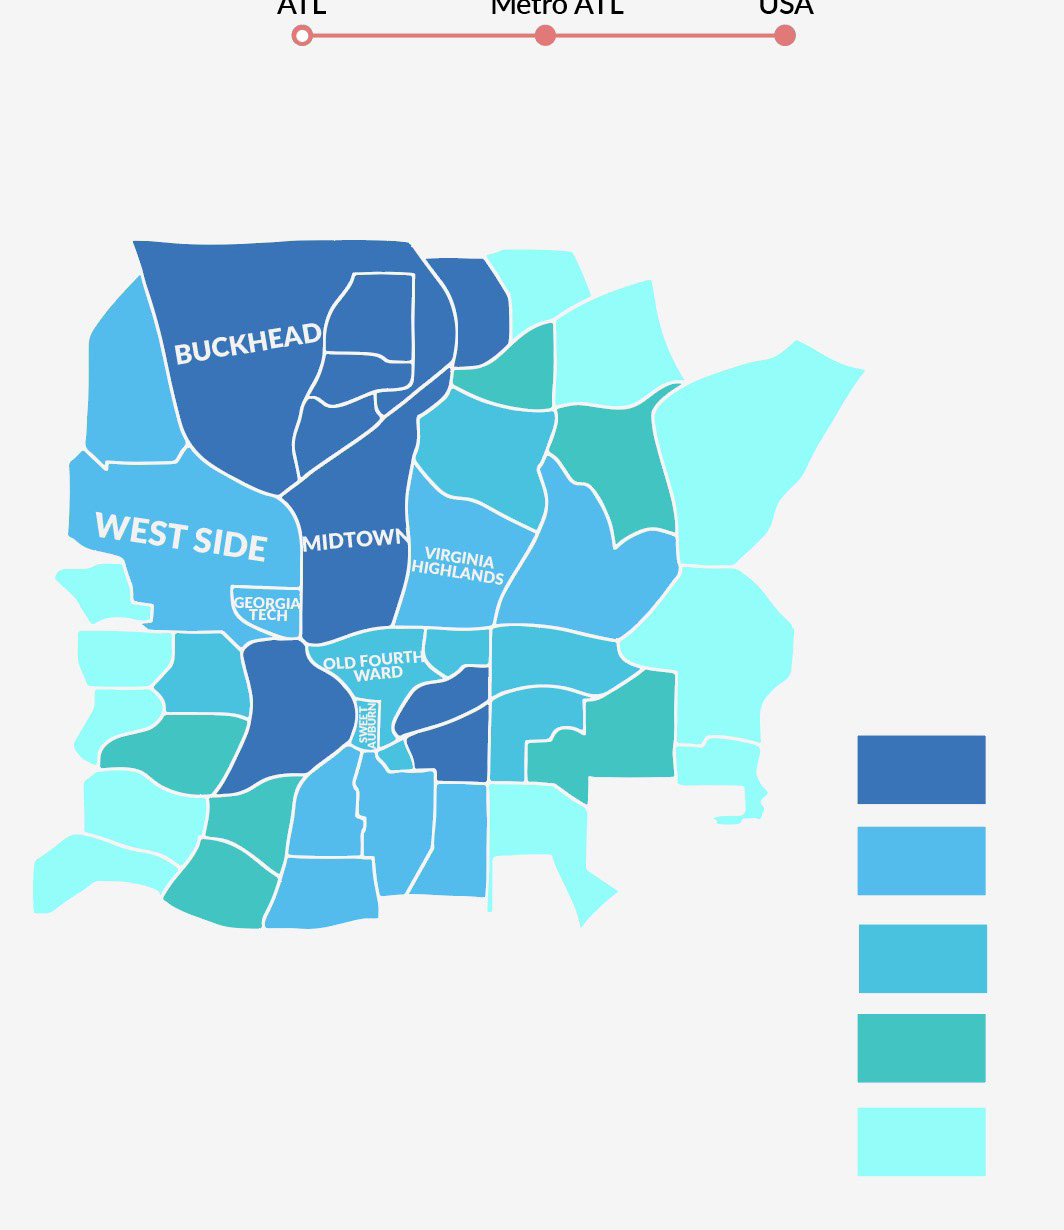
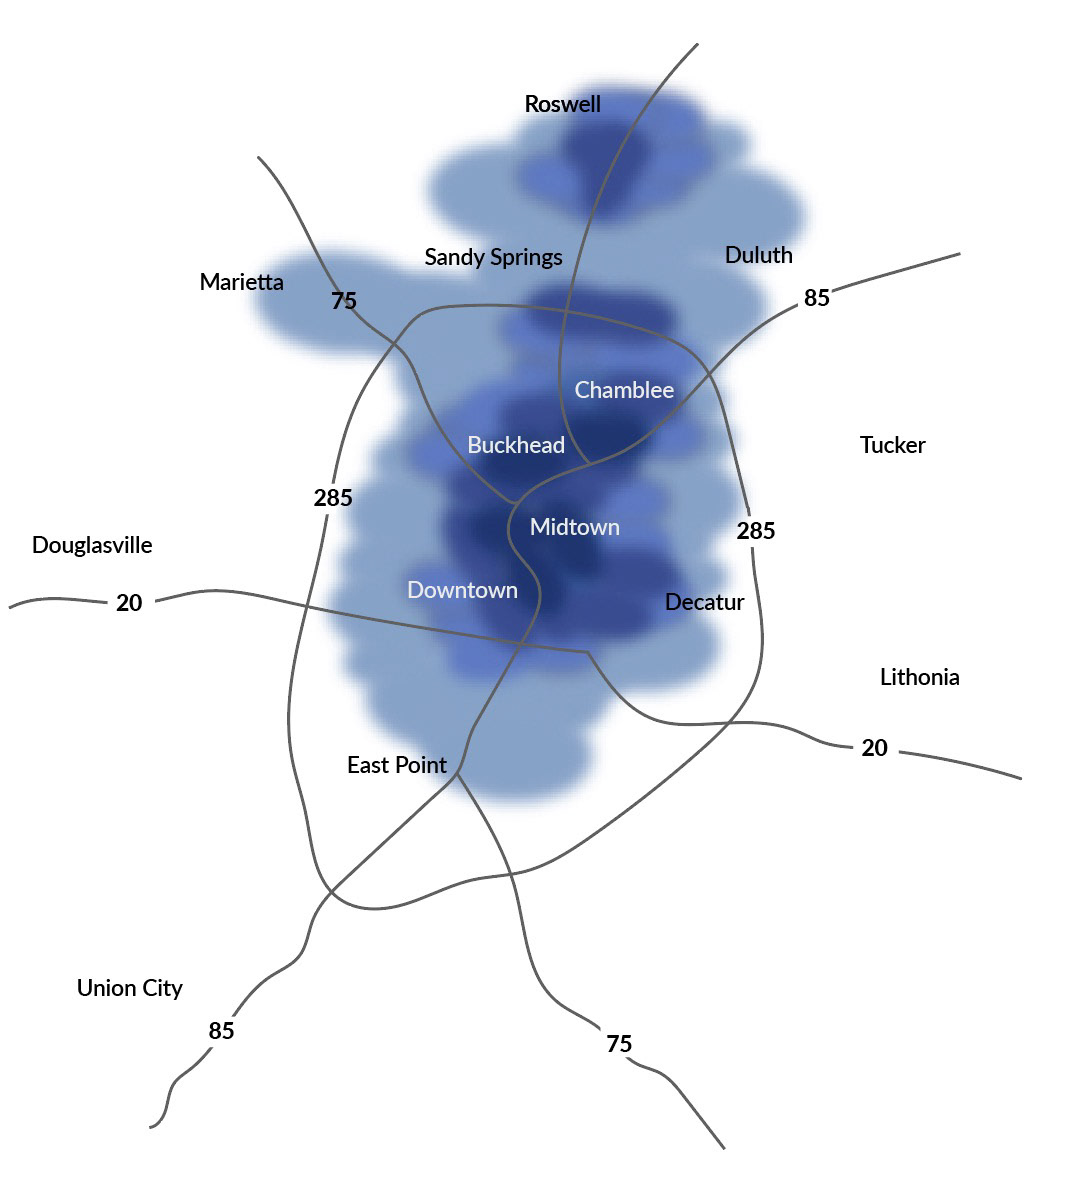
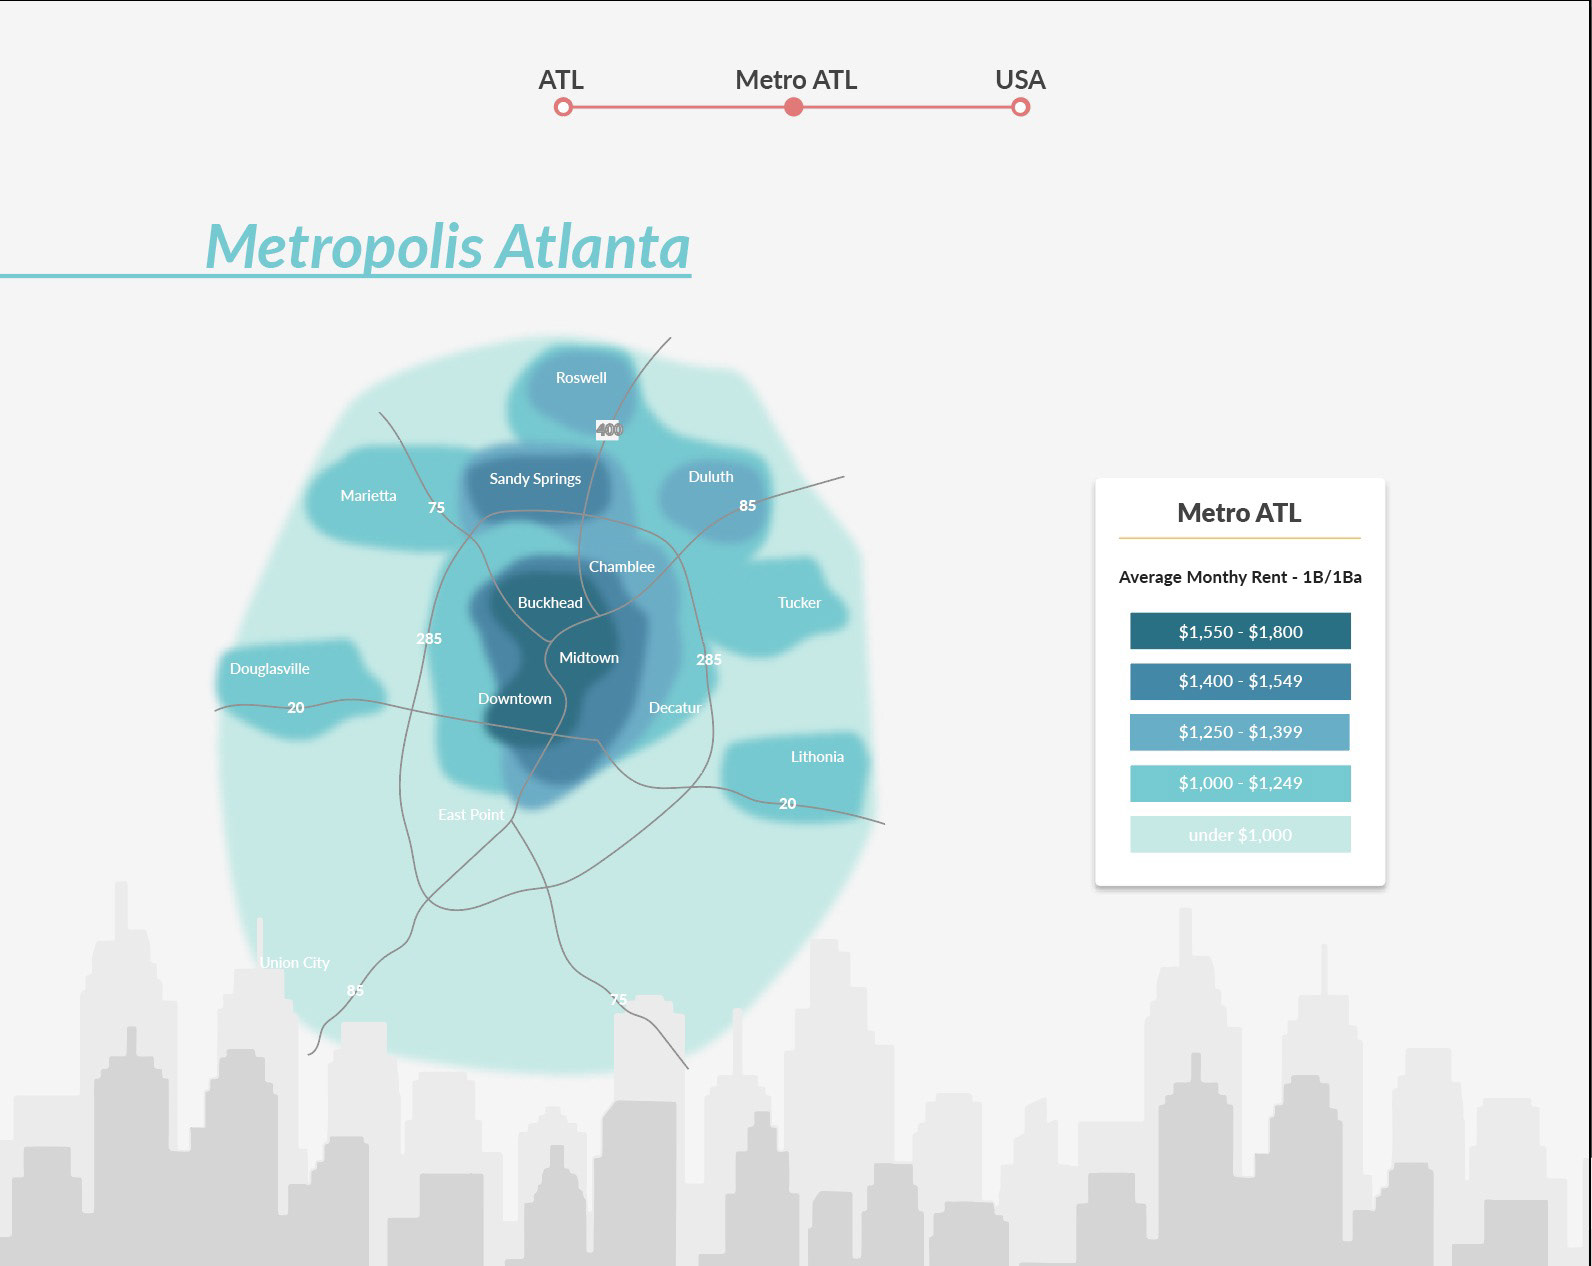
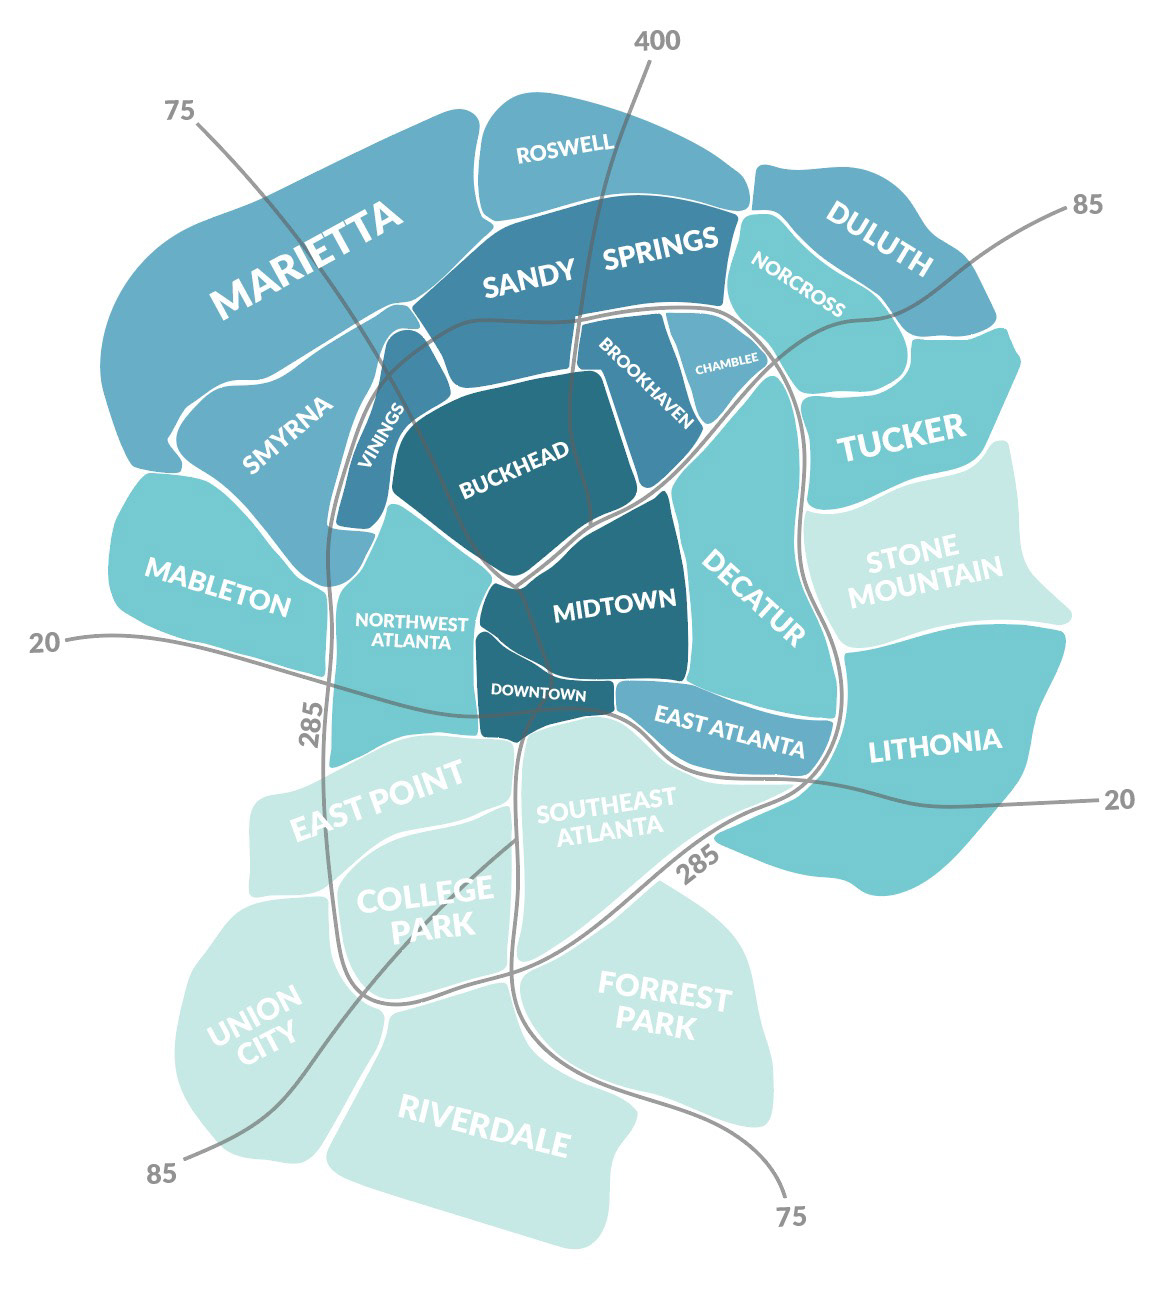
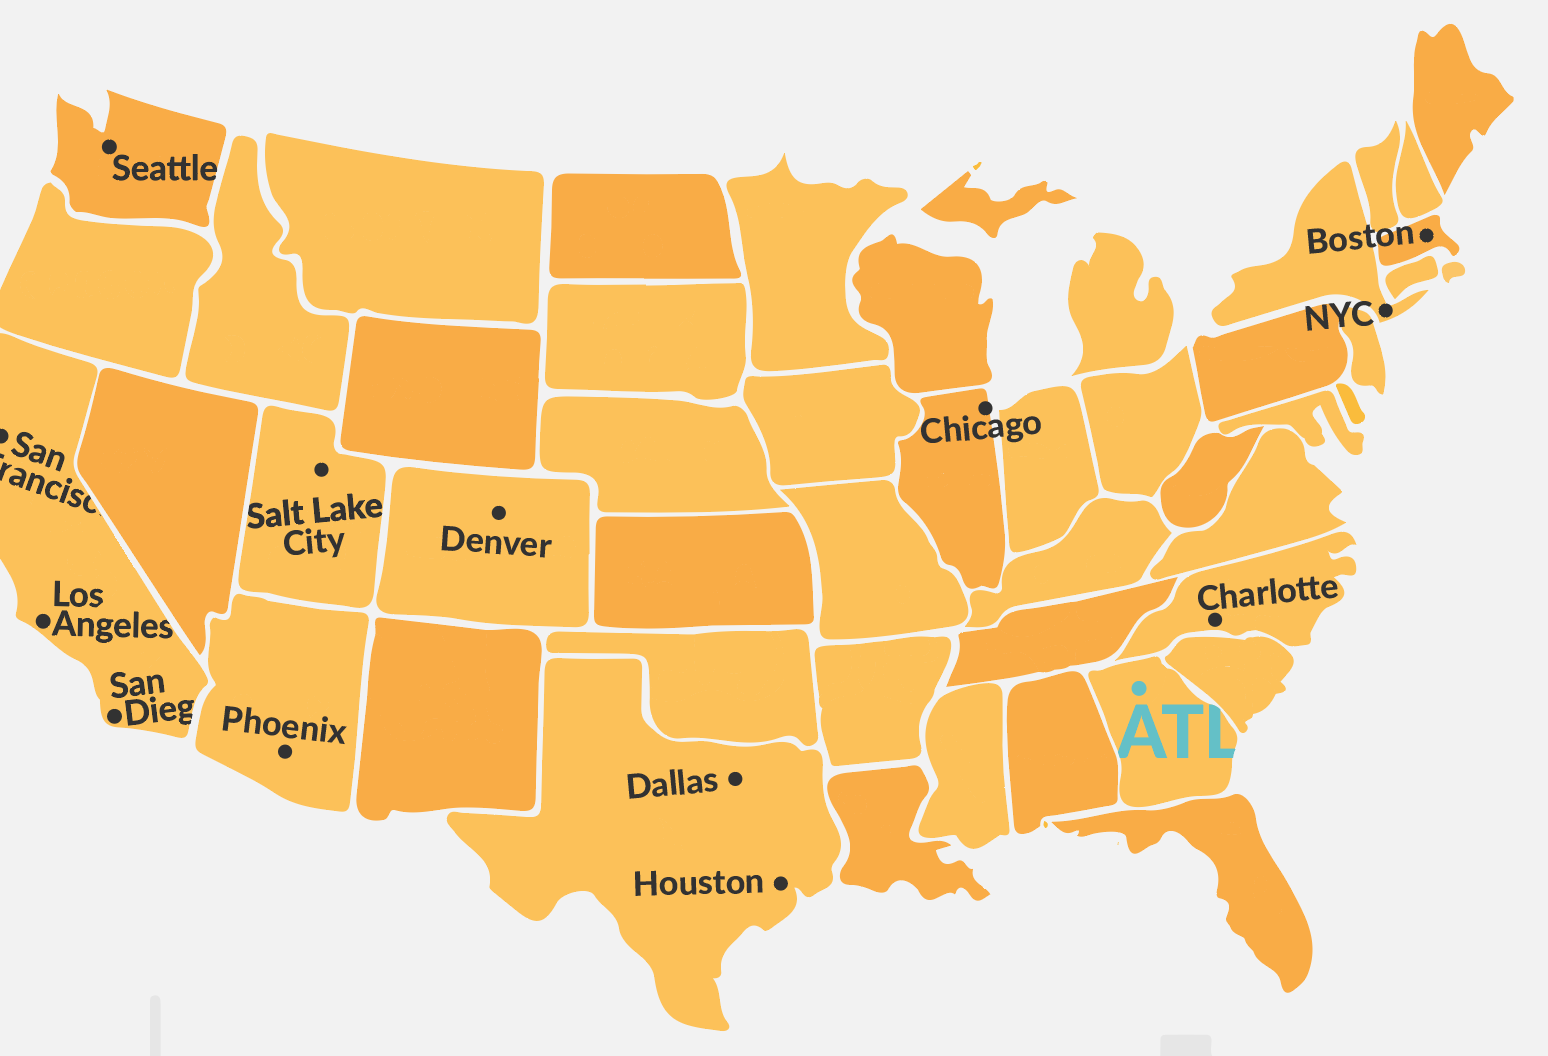
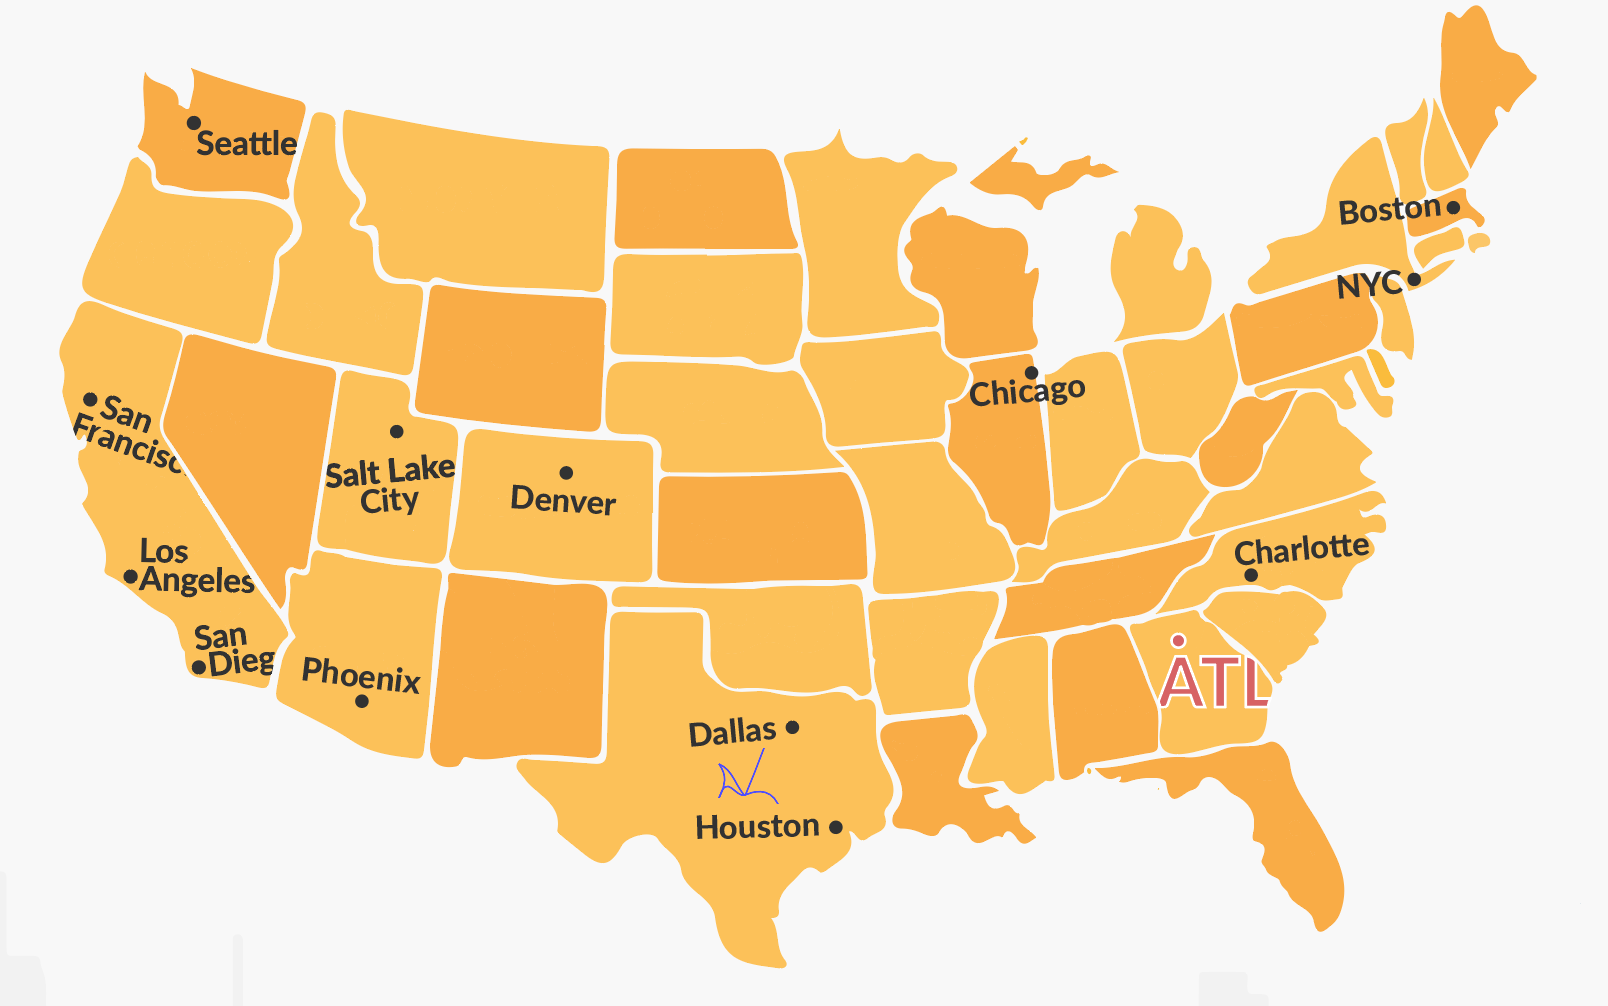
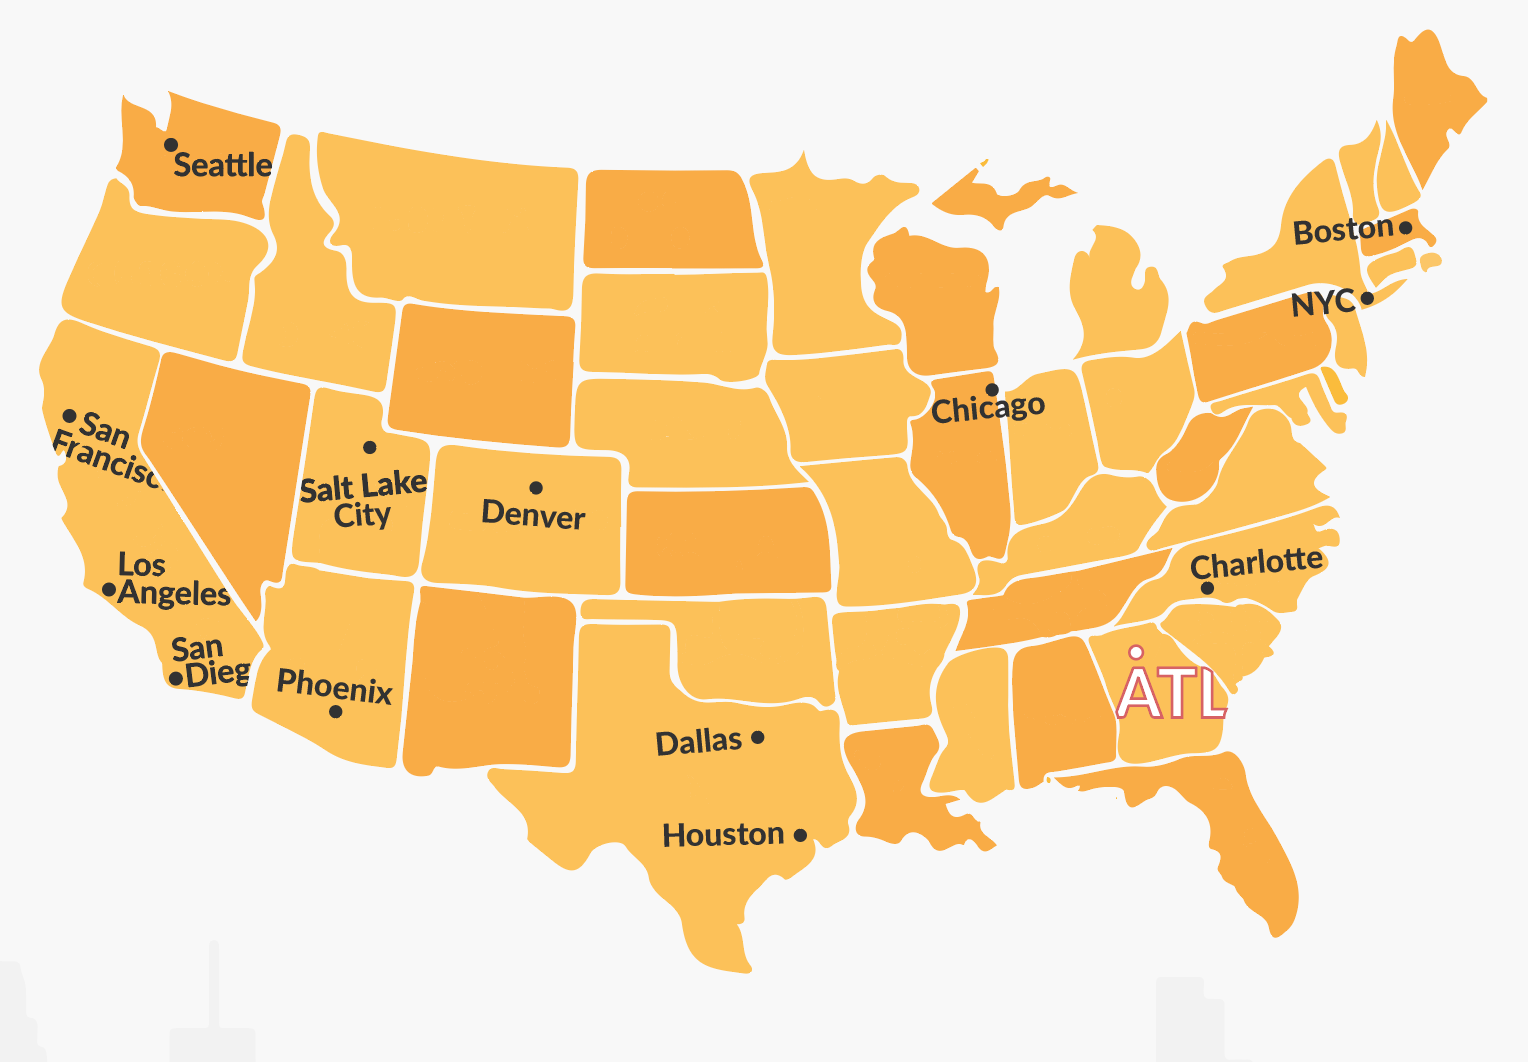
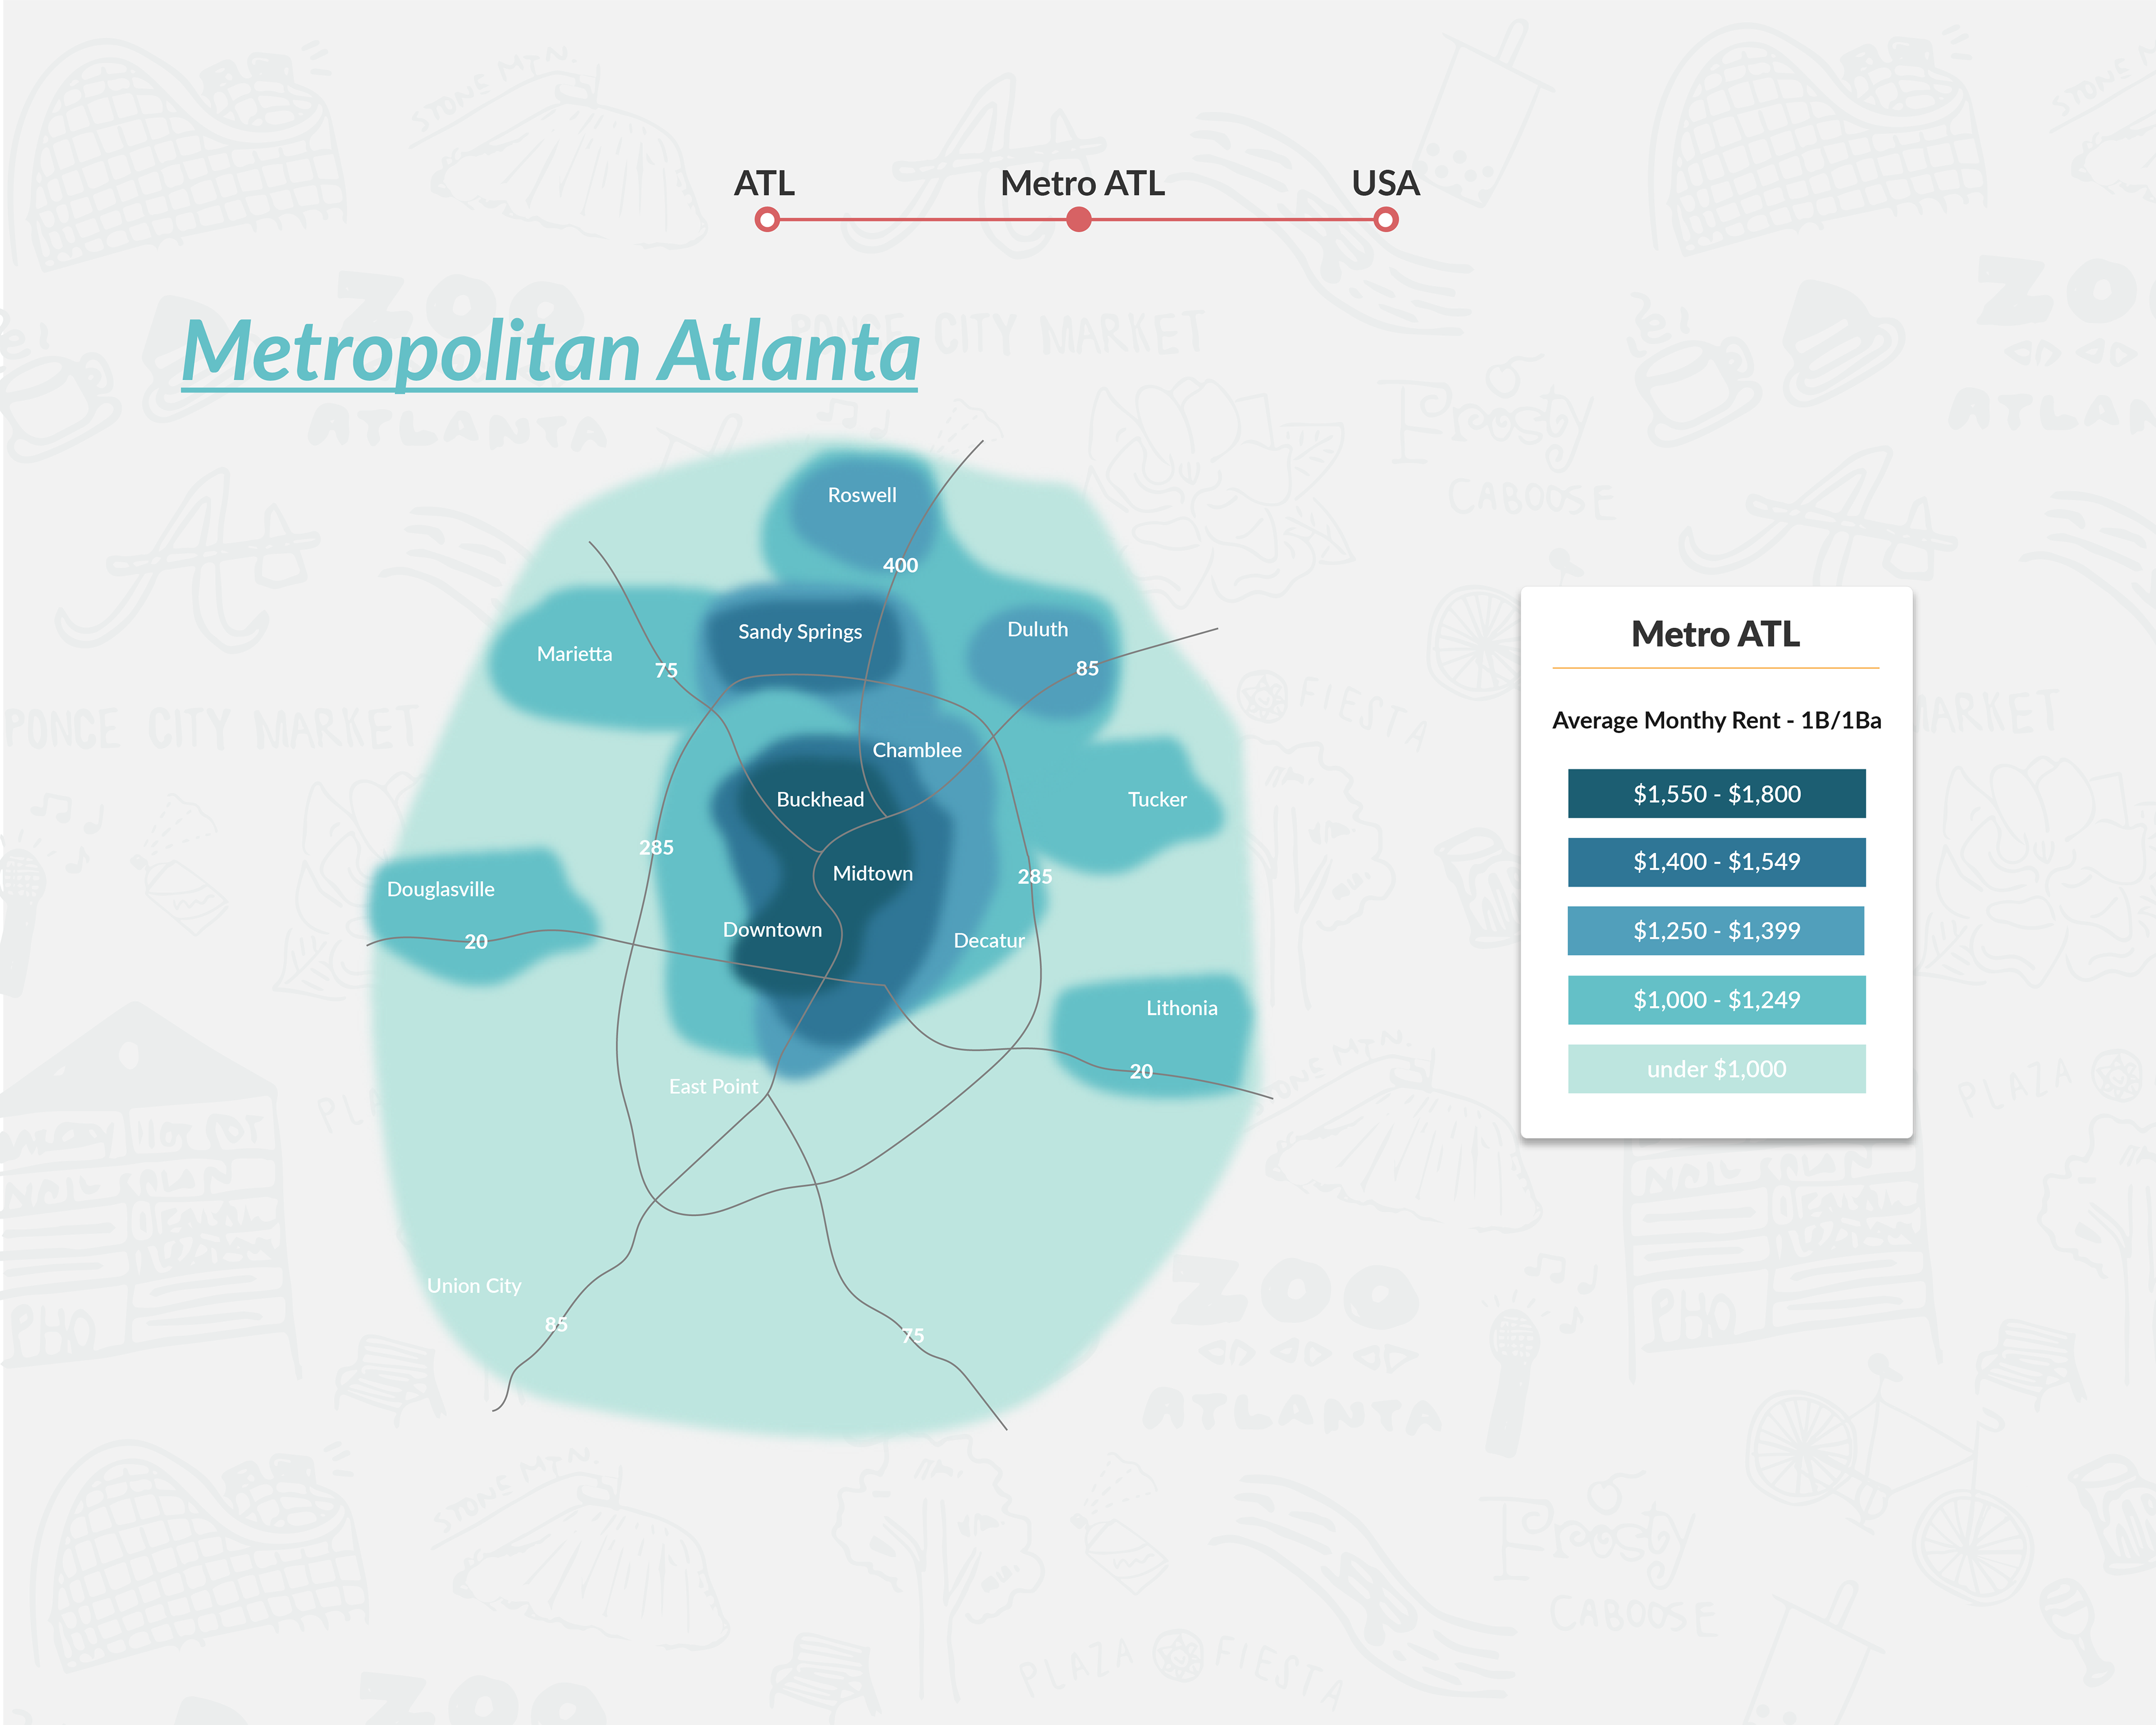
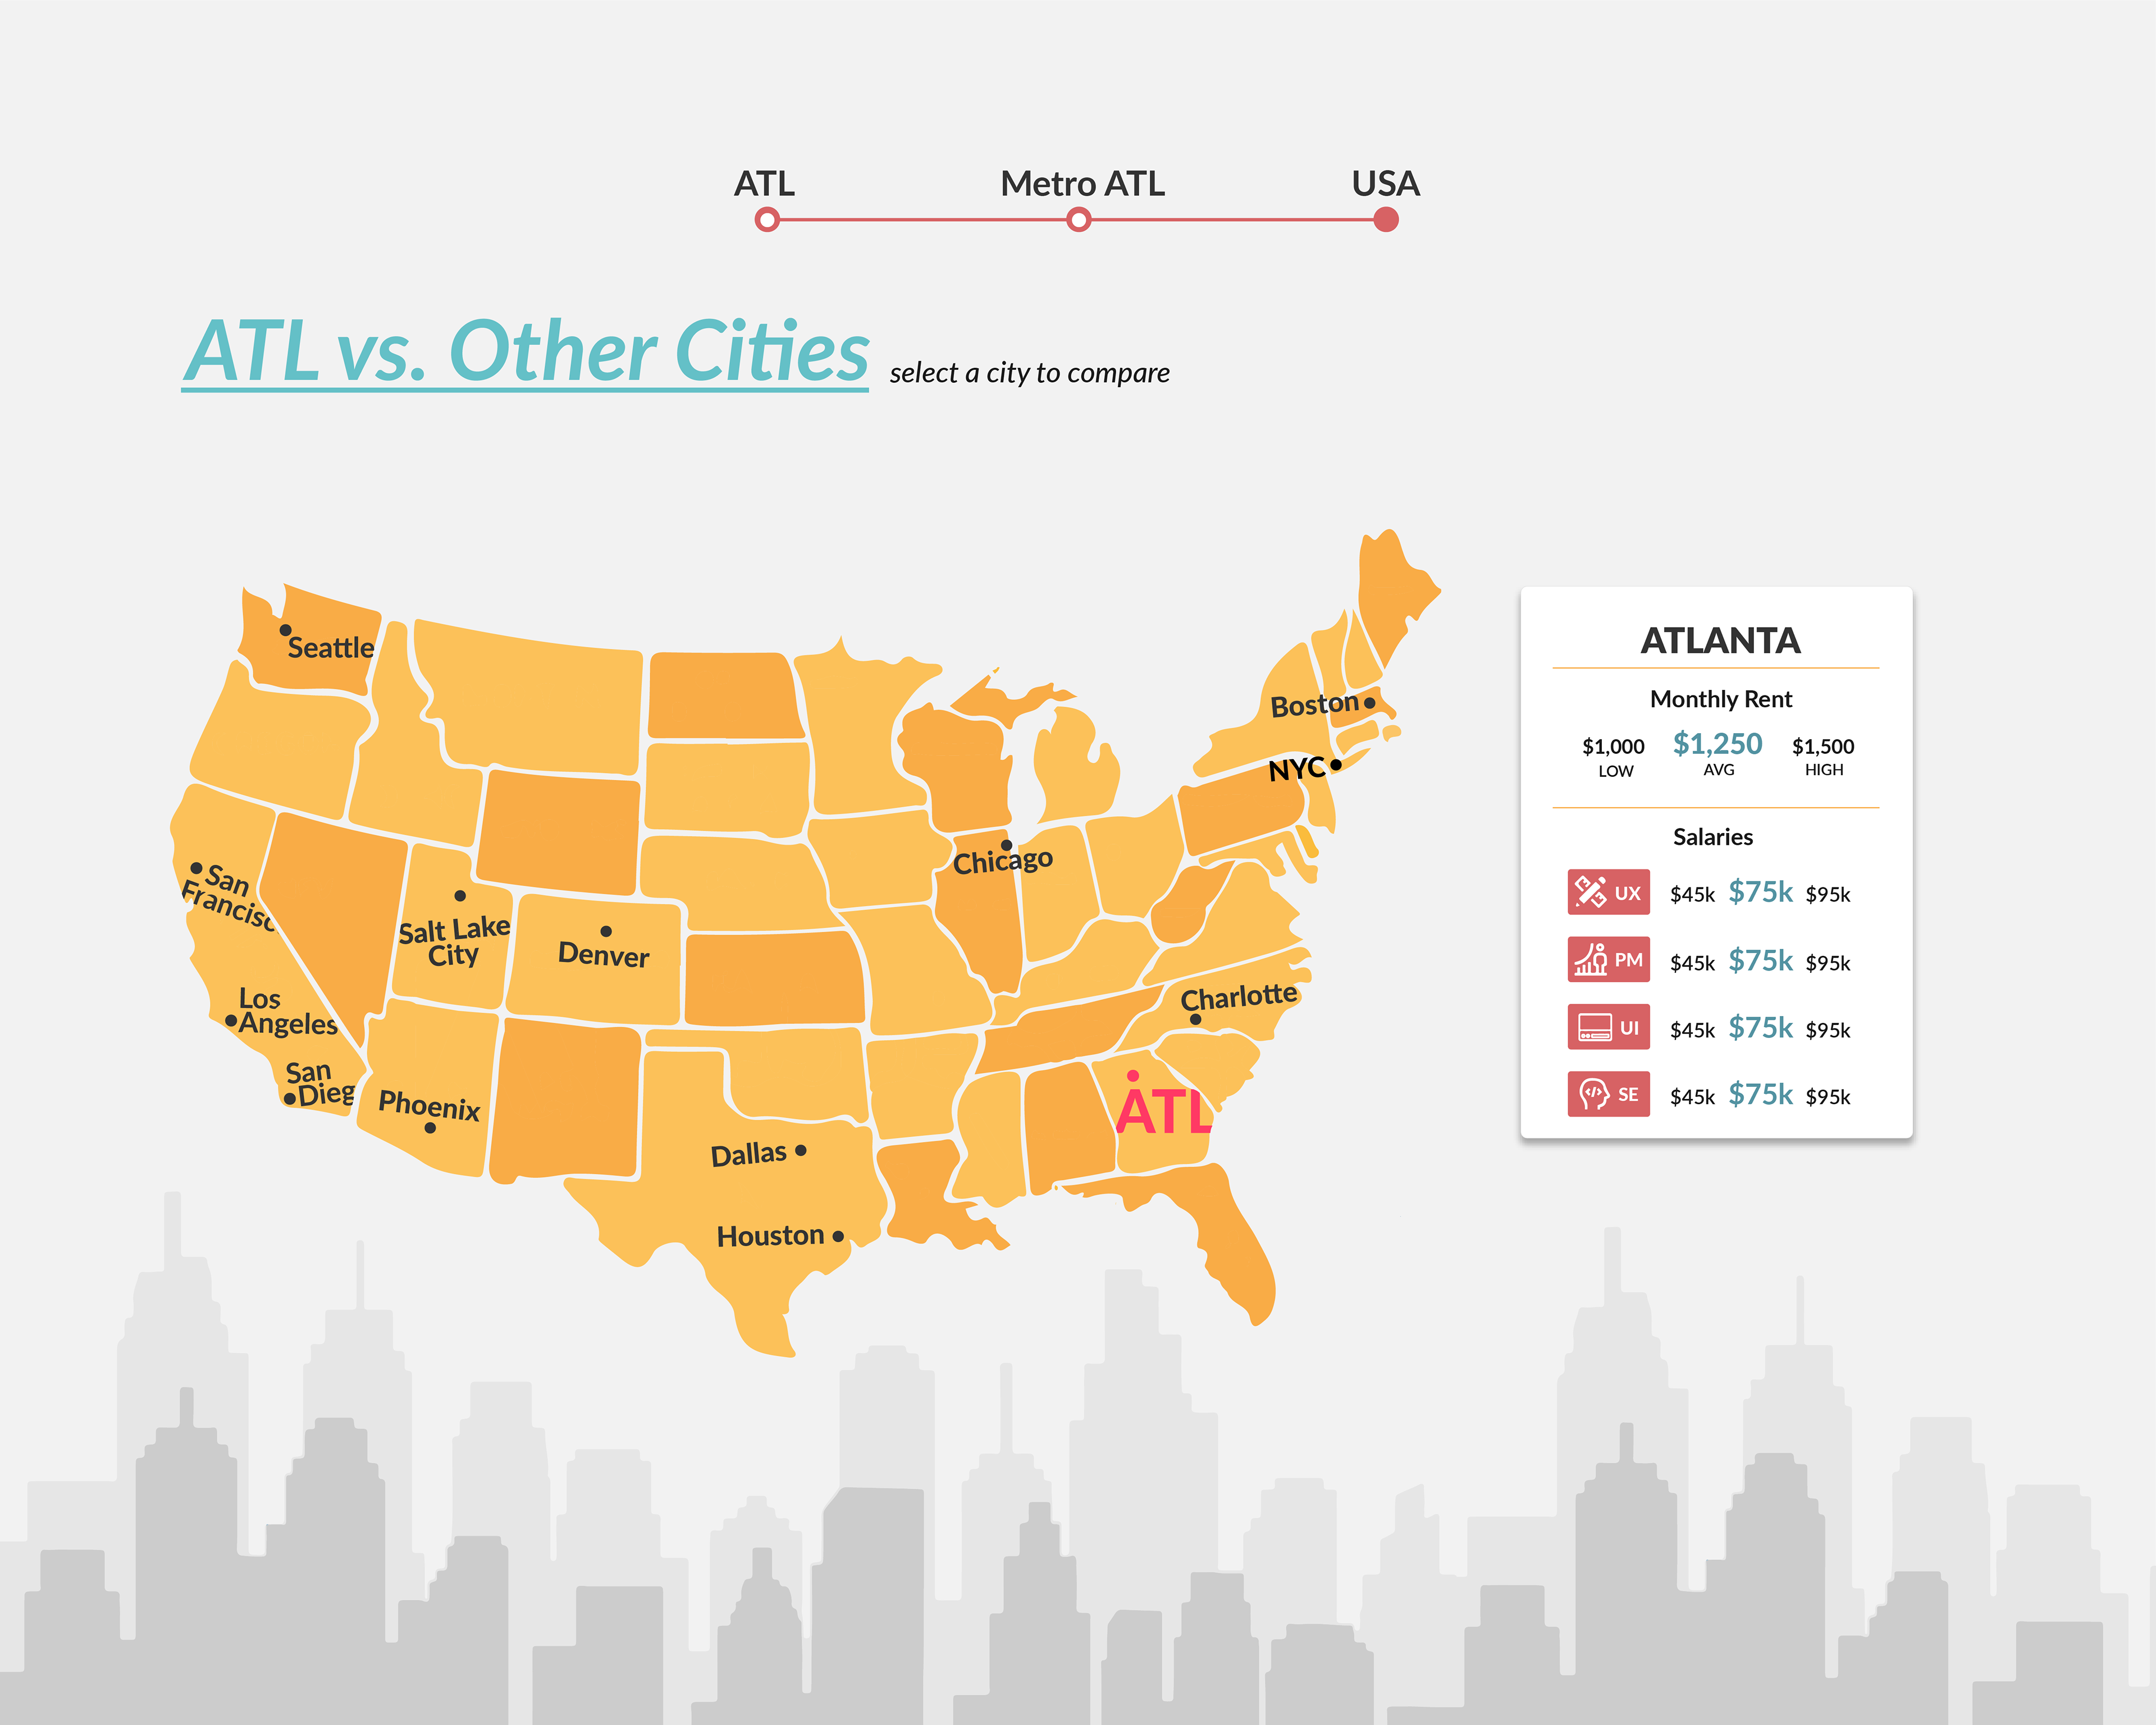
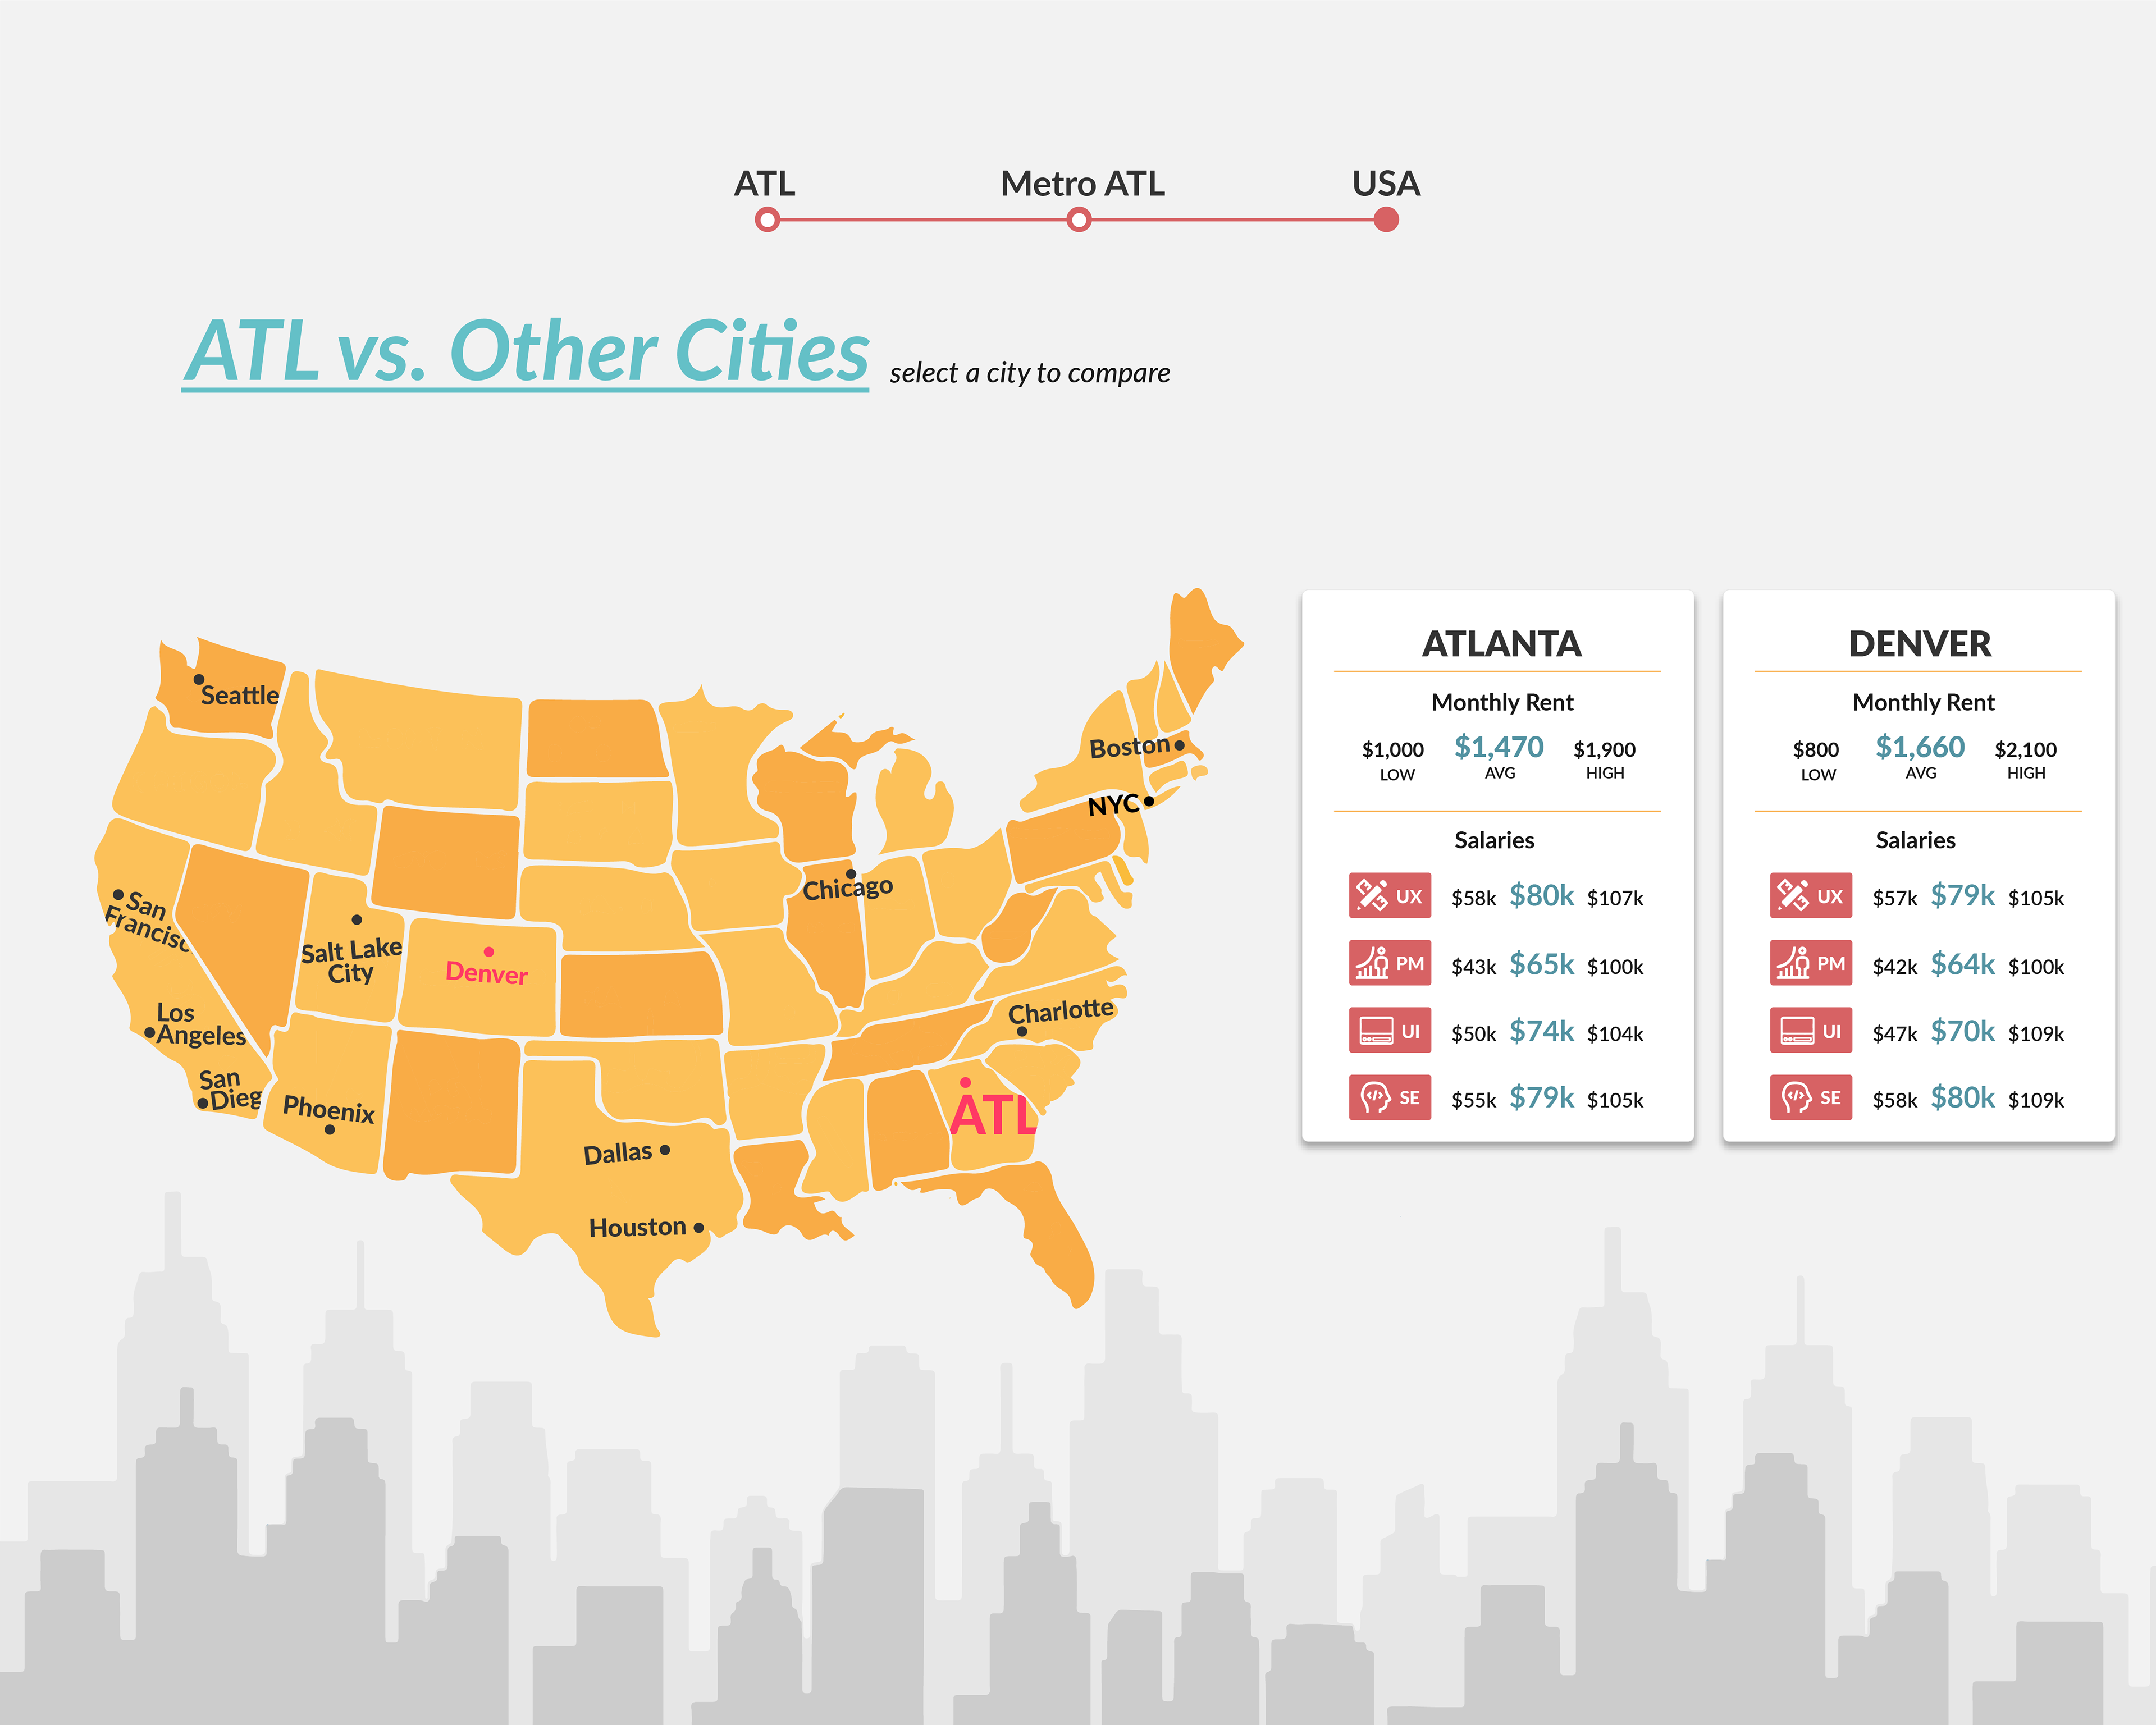
The data we want to present includes average salaries of jobs within the said field as well as rent prices of different areas in Atlanta and the United States. Each visualization was intended to represent different levels but all viewable on a single screen. The heat map would be the most “zoomed in” and specific view while the interactive map would be a view of the nation overall.
milestone 2: first digital iteration
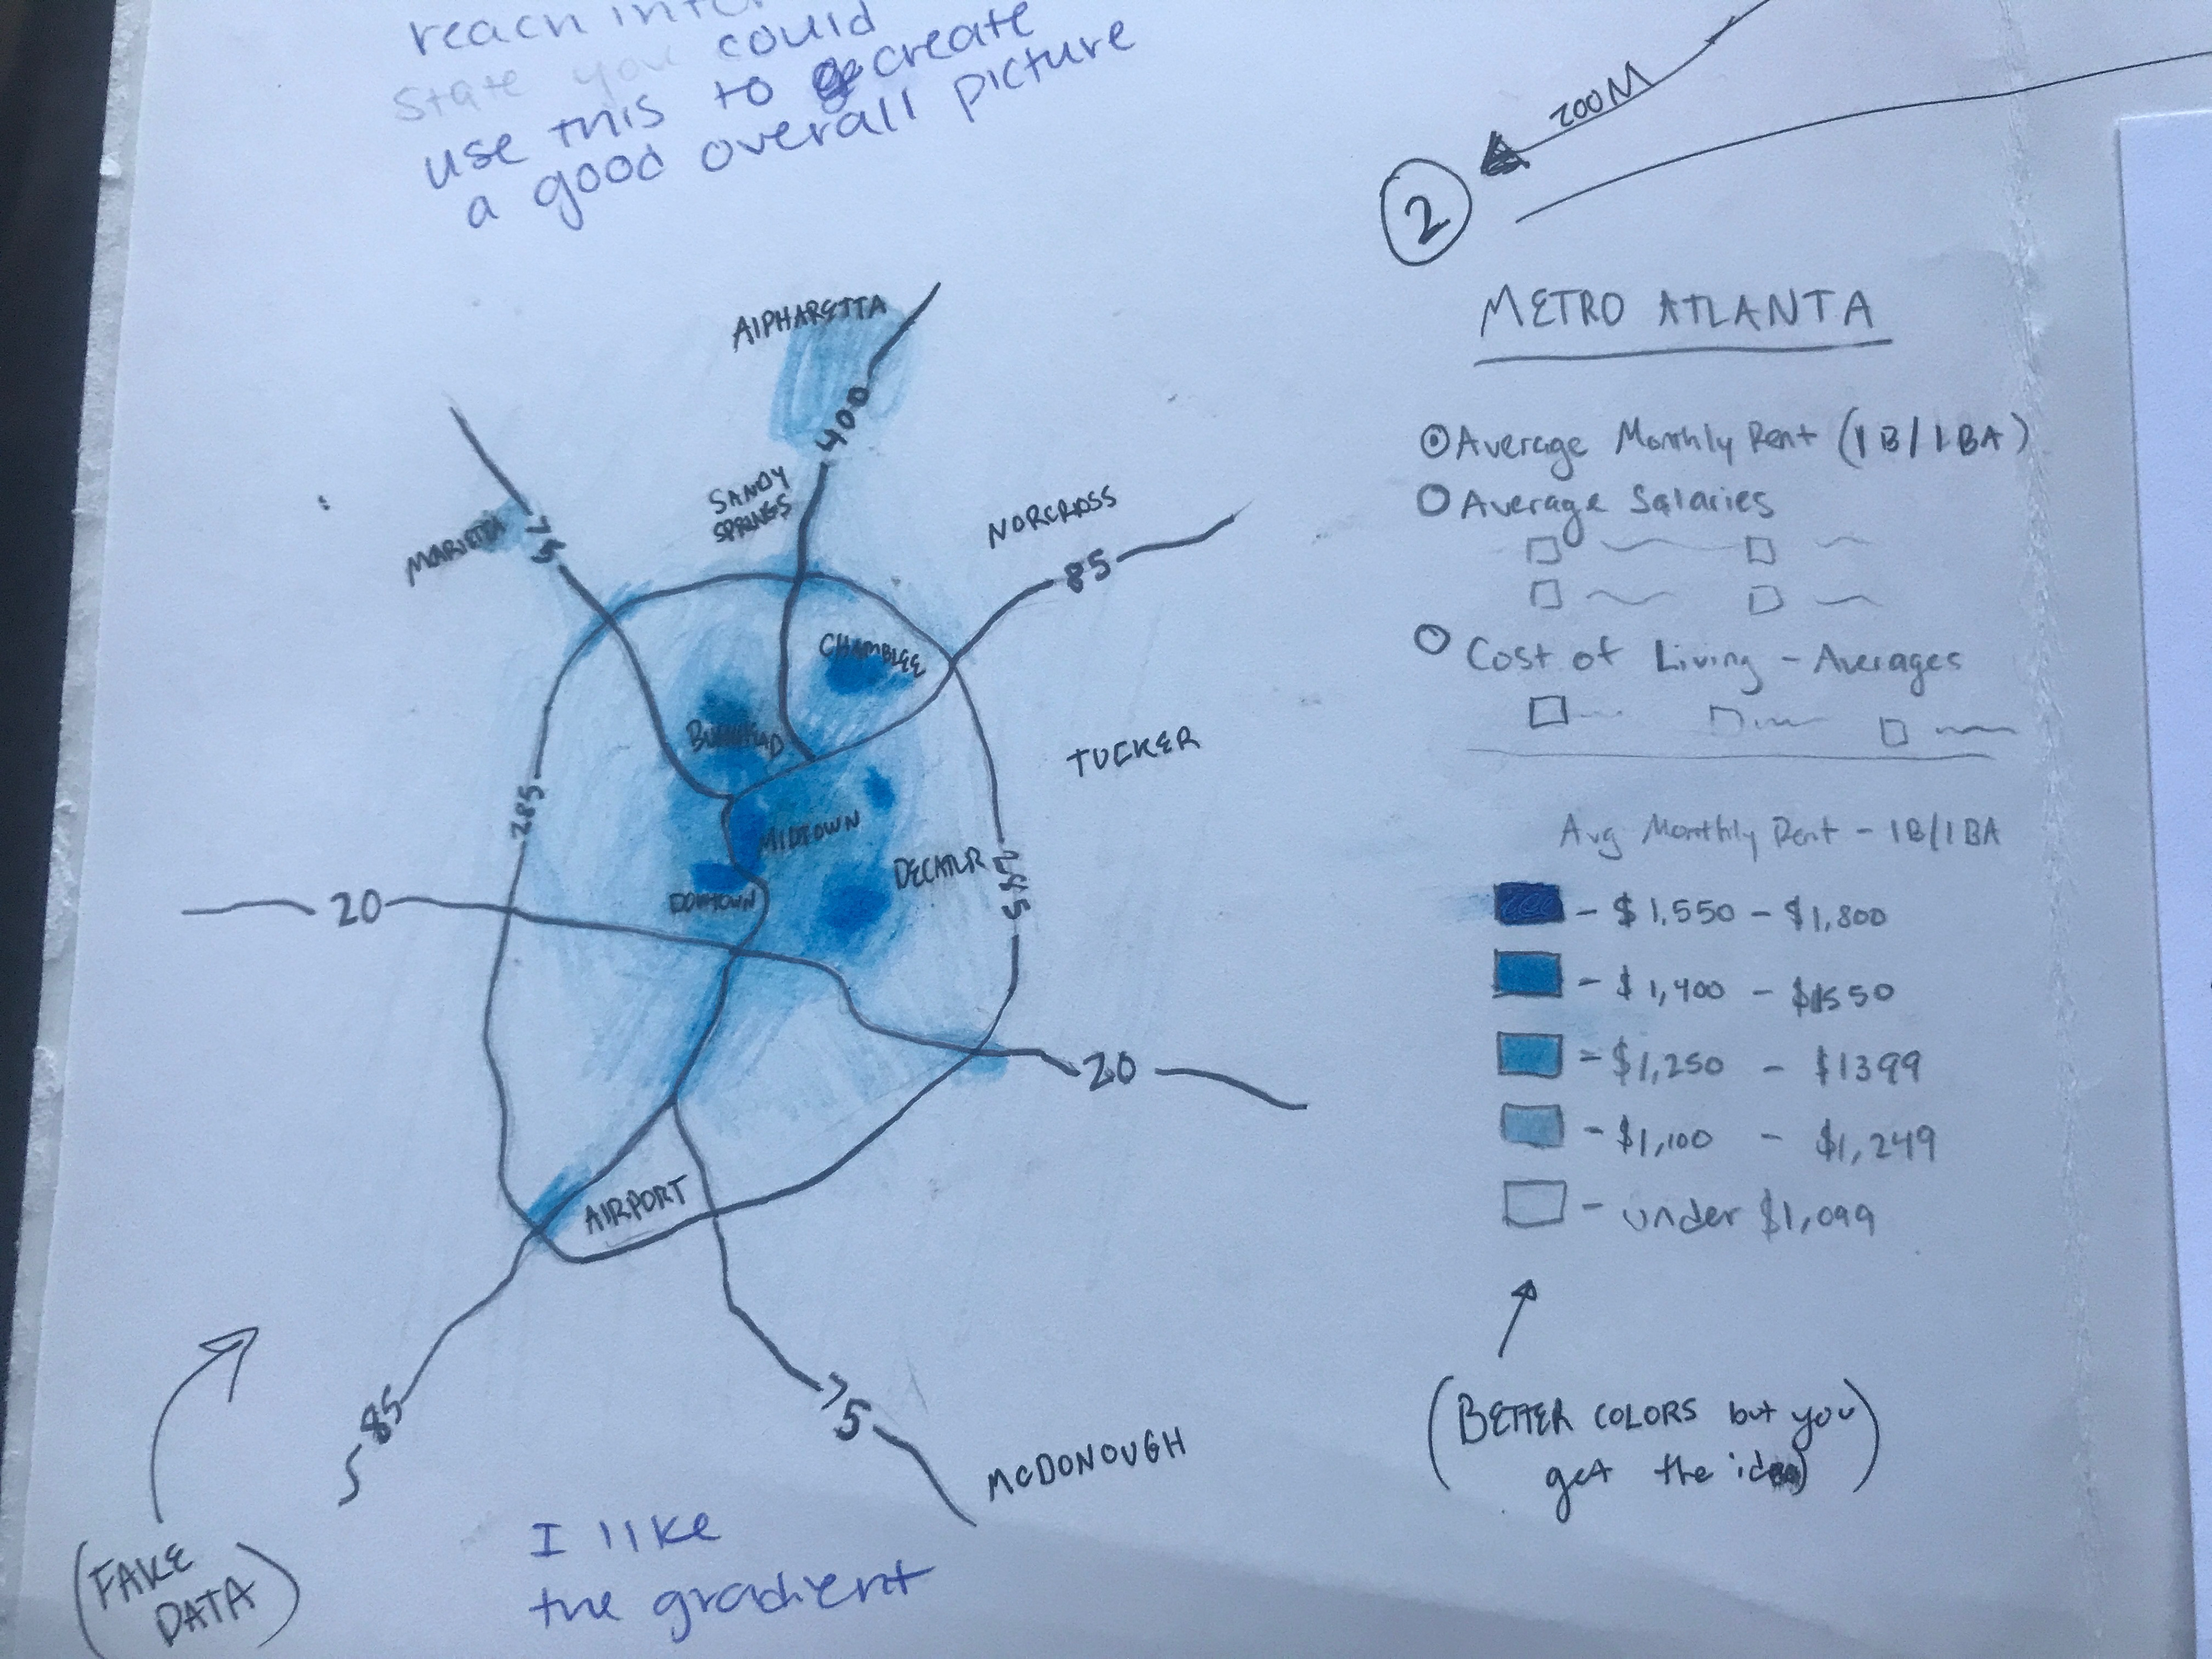
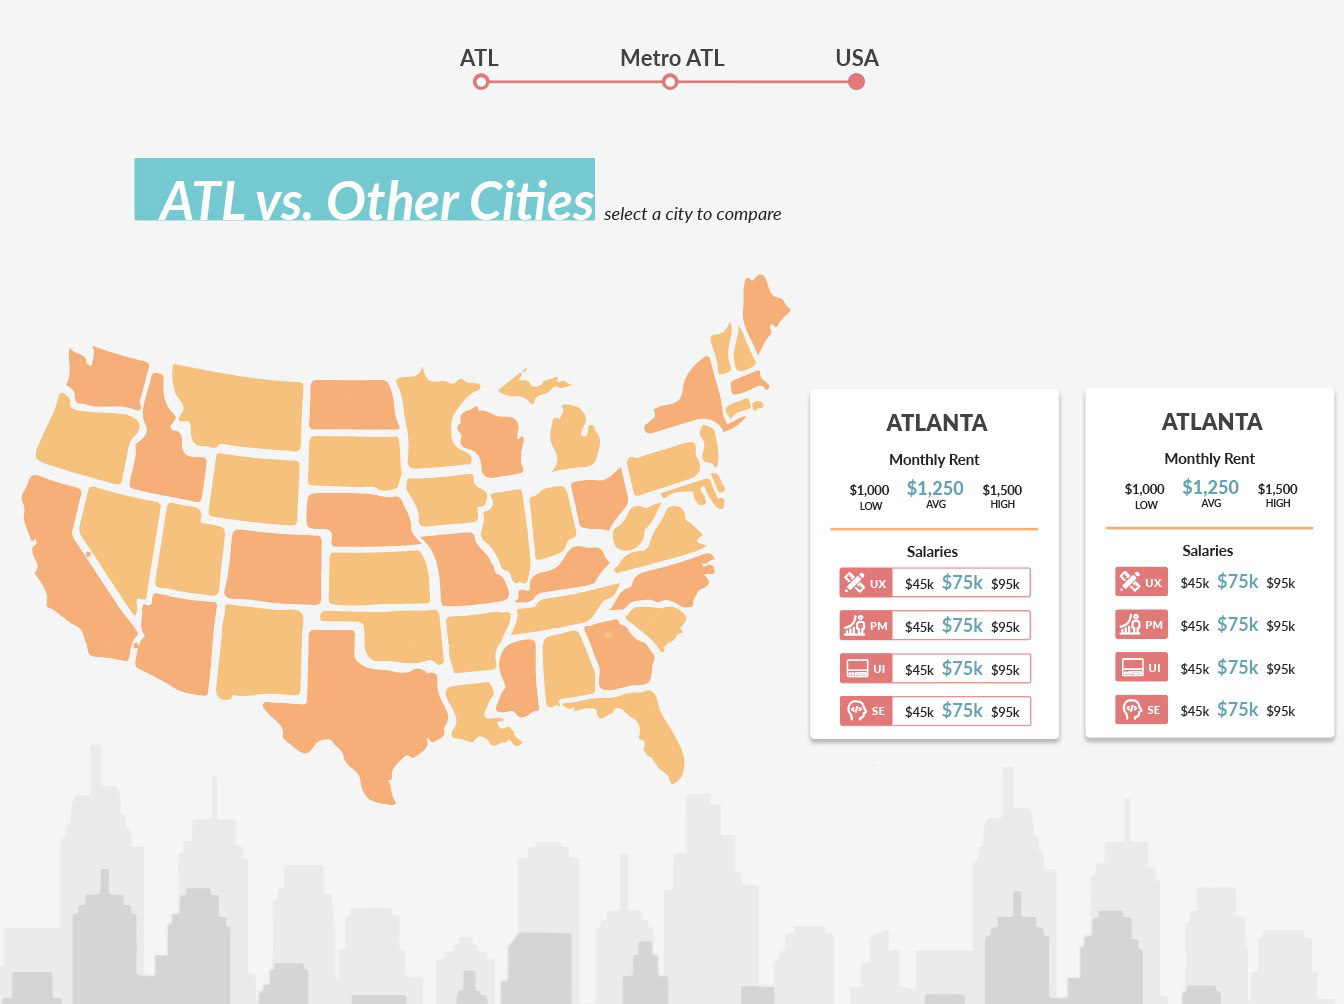
With our first digital iteration, we wanted to find a way to combine all three views into a single application. The datasets we wanted to look at were cost of living per city, average rent, and salary data, with the salary data being job-specific to students in Georgia Tech’s Computational Media program. The issue with this was that we wanted salaries that were geographically specific. Because there is limited and inaccurate data that fits that criterion, we decided to look at salary datasets for broader geographical areas that included multiple cities as opposed to ones for specific cities. Another issue we had was that the cost of living varies from person to person, as that includes transportation, dining, living with others and etc. After receiving feedback from this iteration, we chose to eliminate the cost of living element and solely collect the average rent of cities.
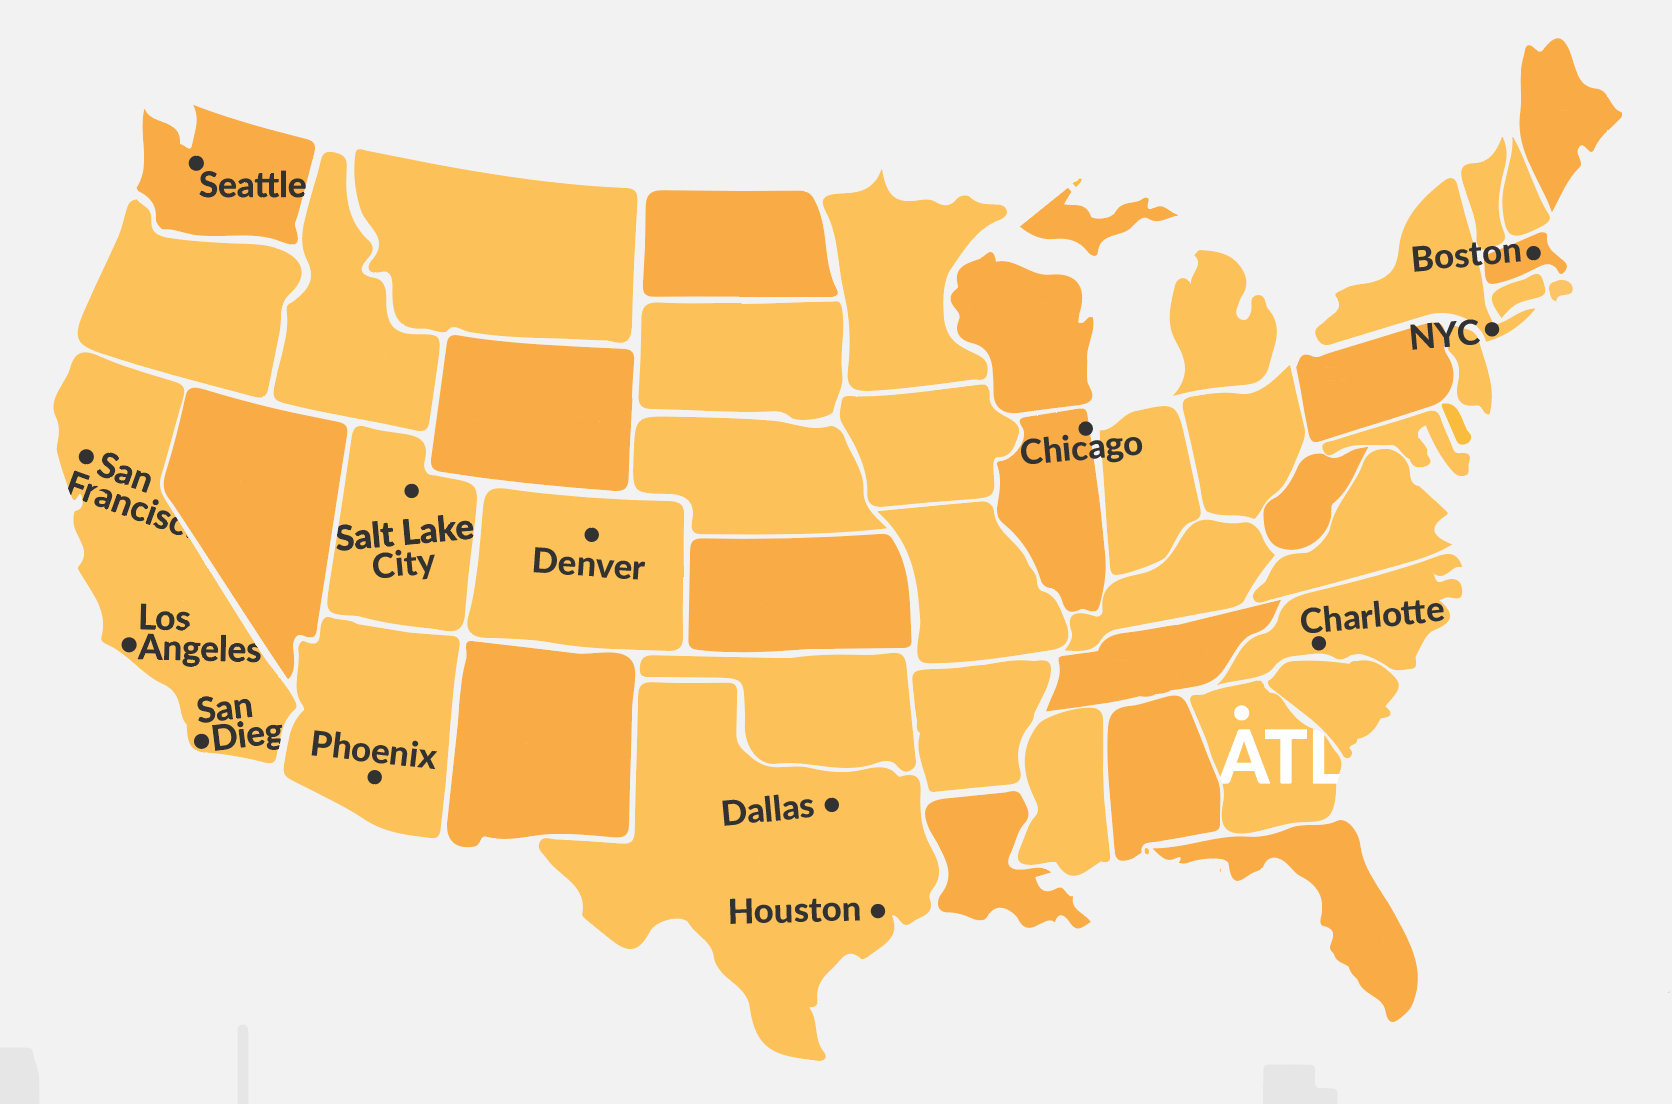
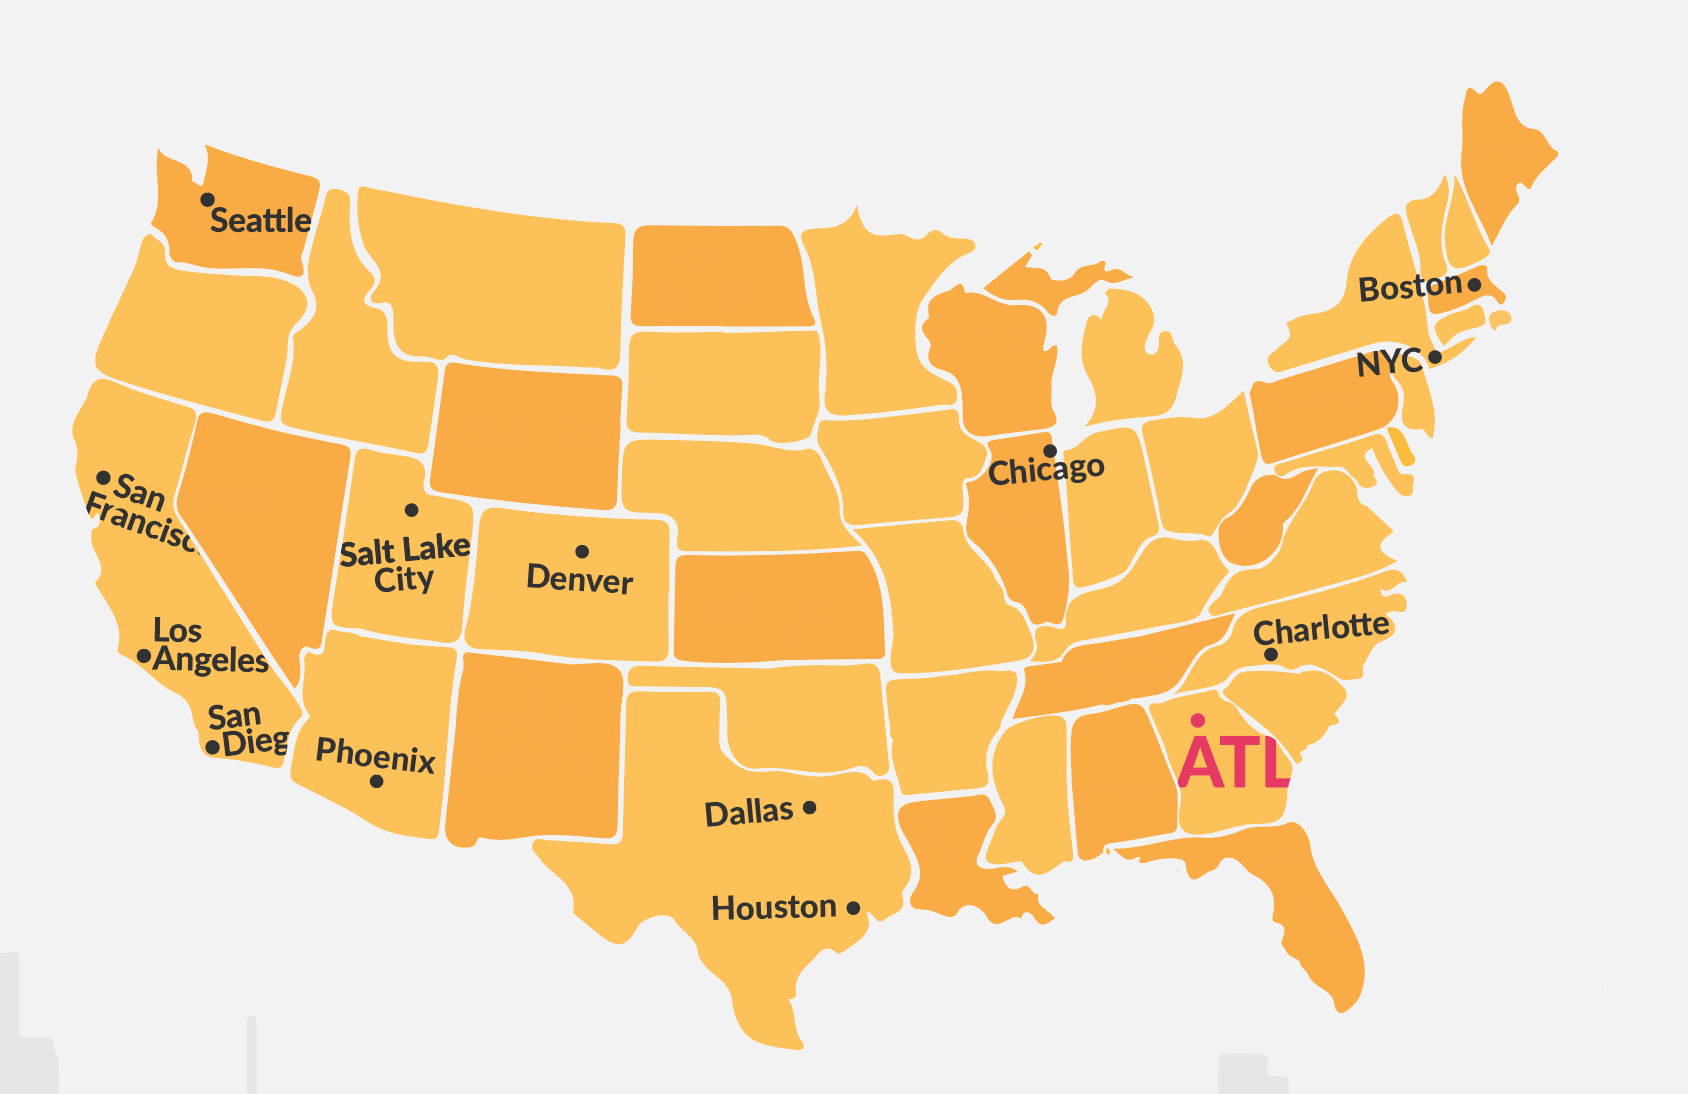
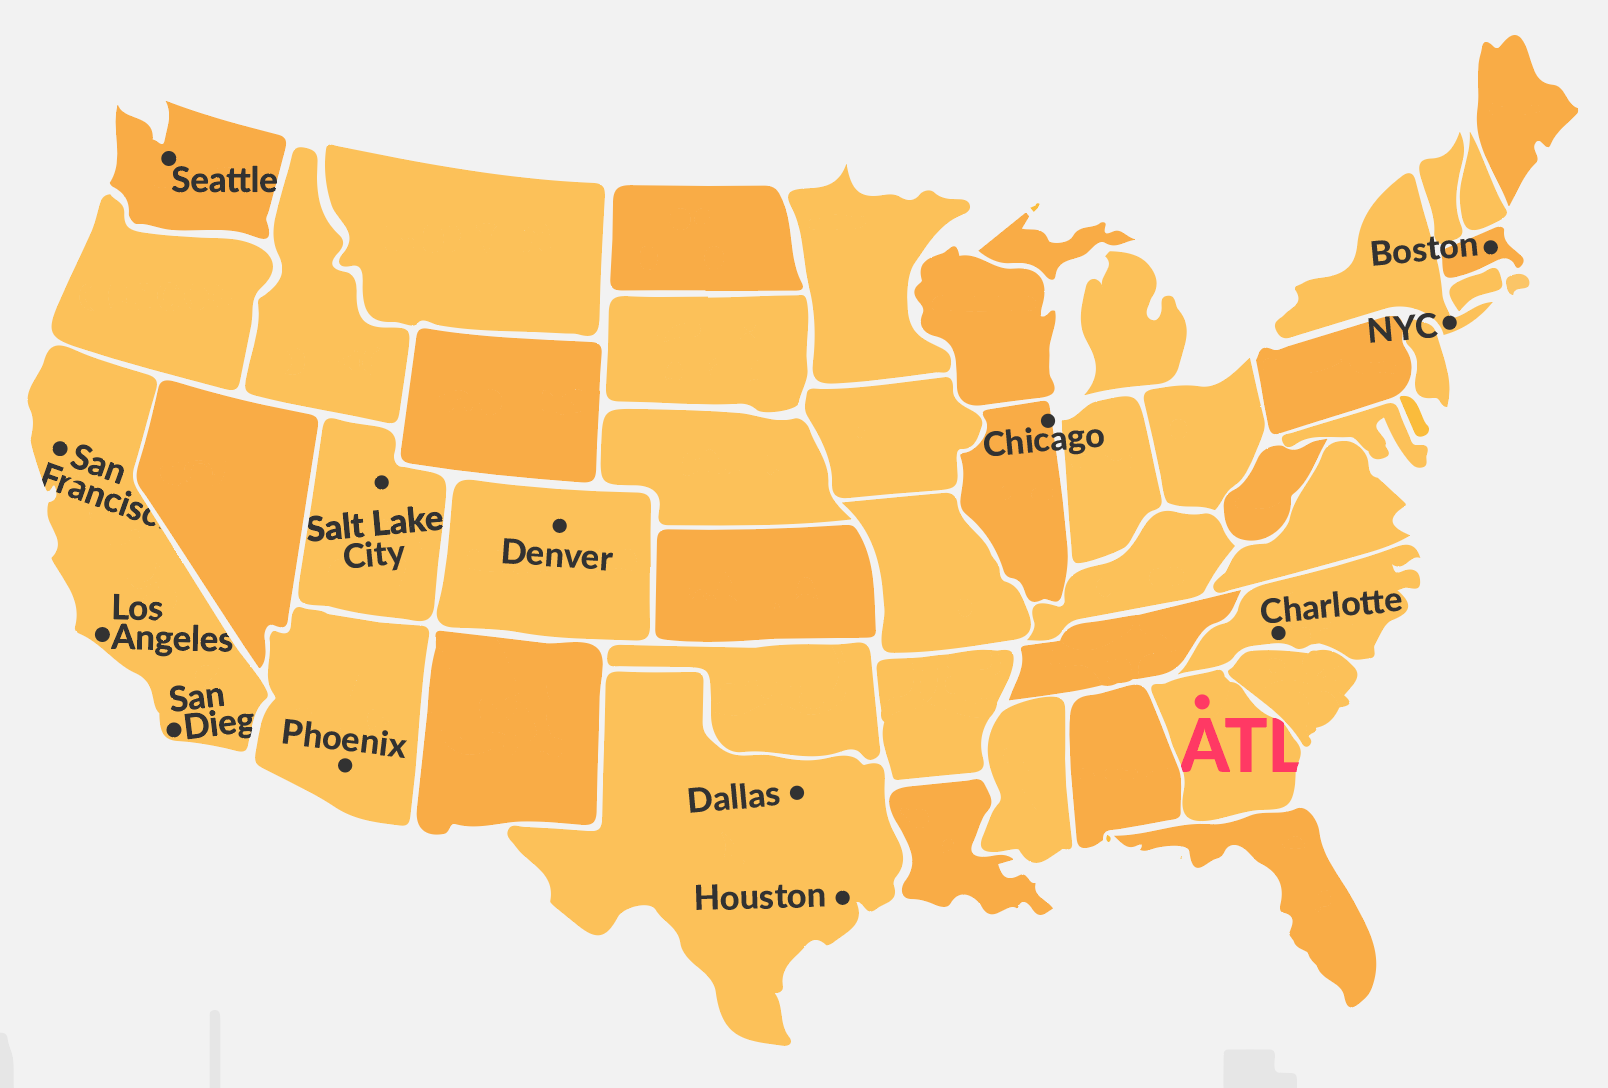
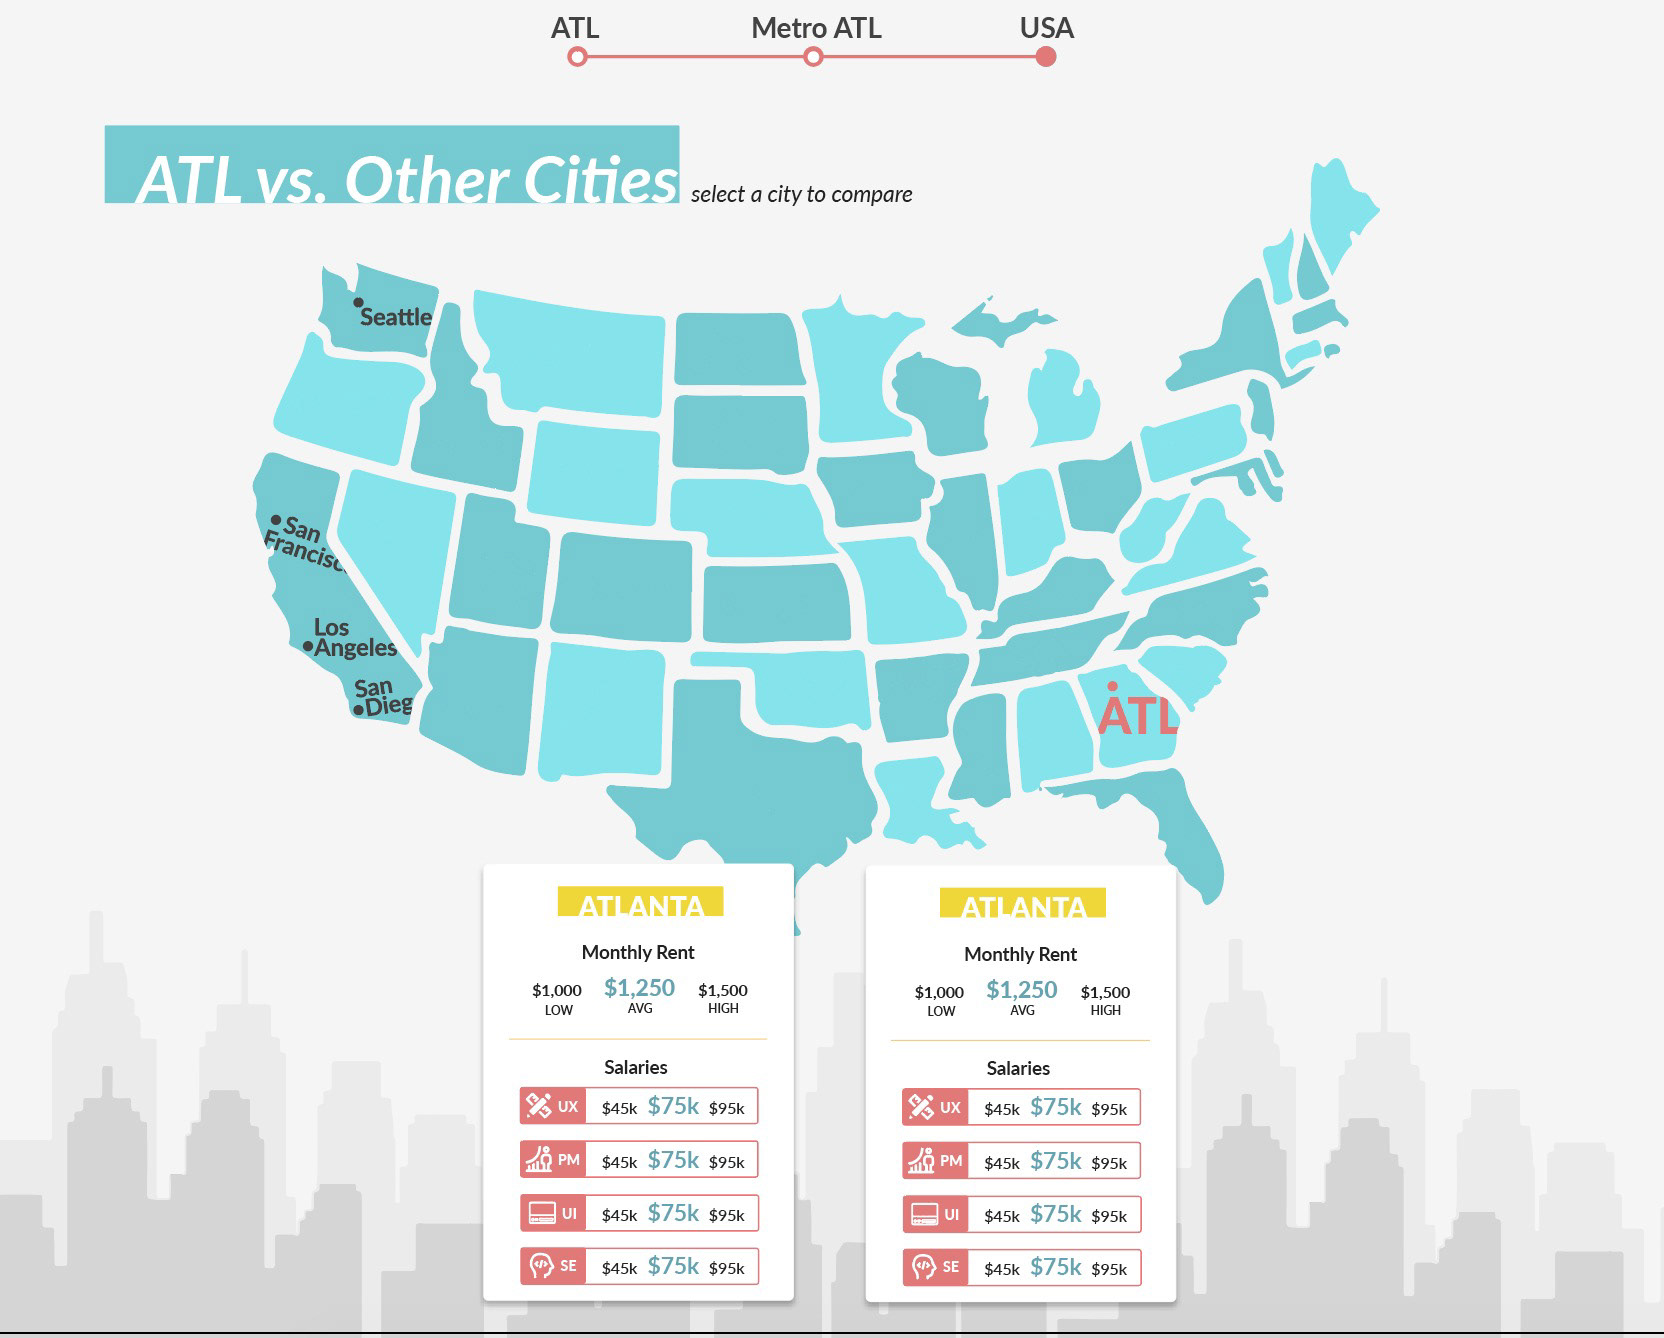
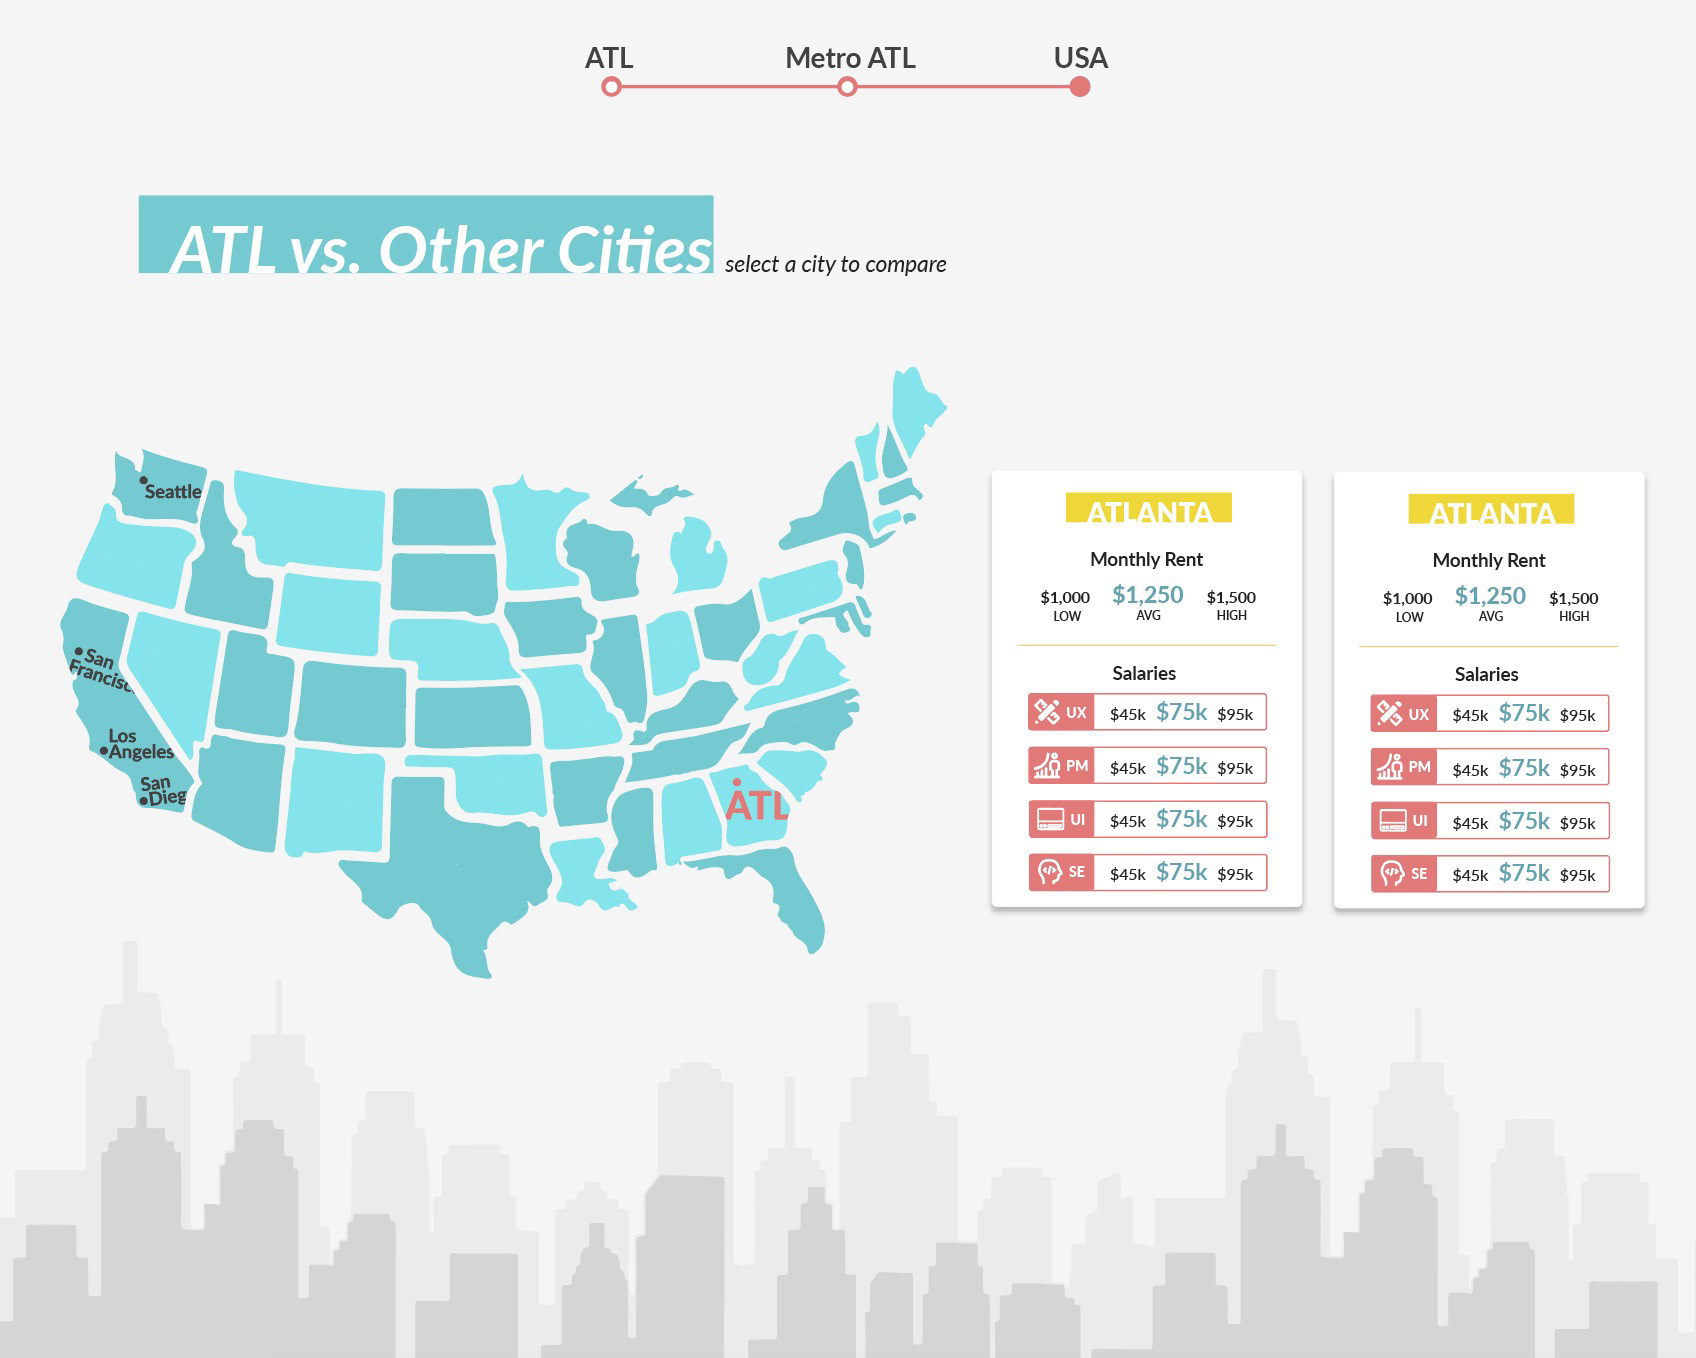
milestone 3: color and typography
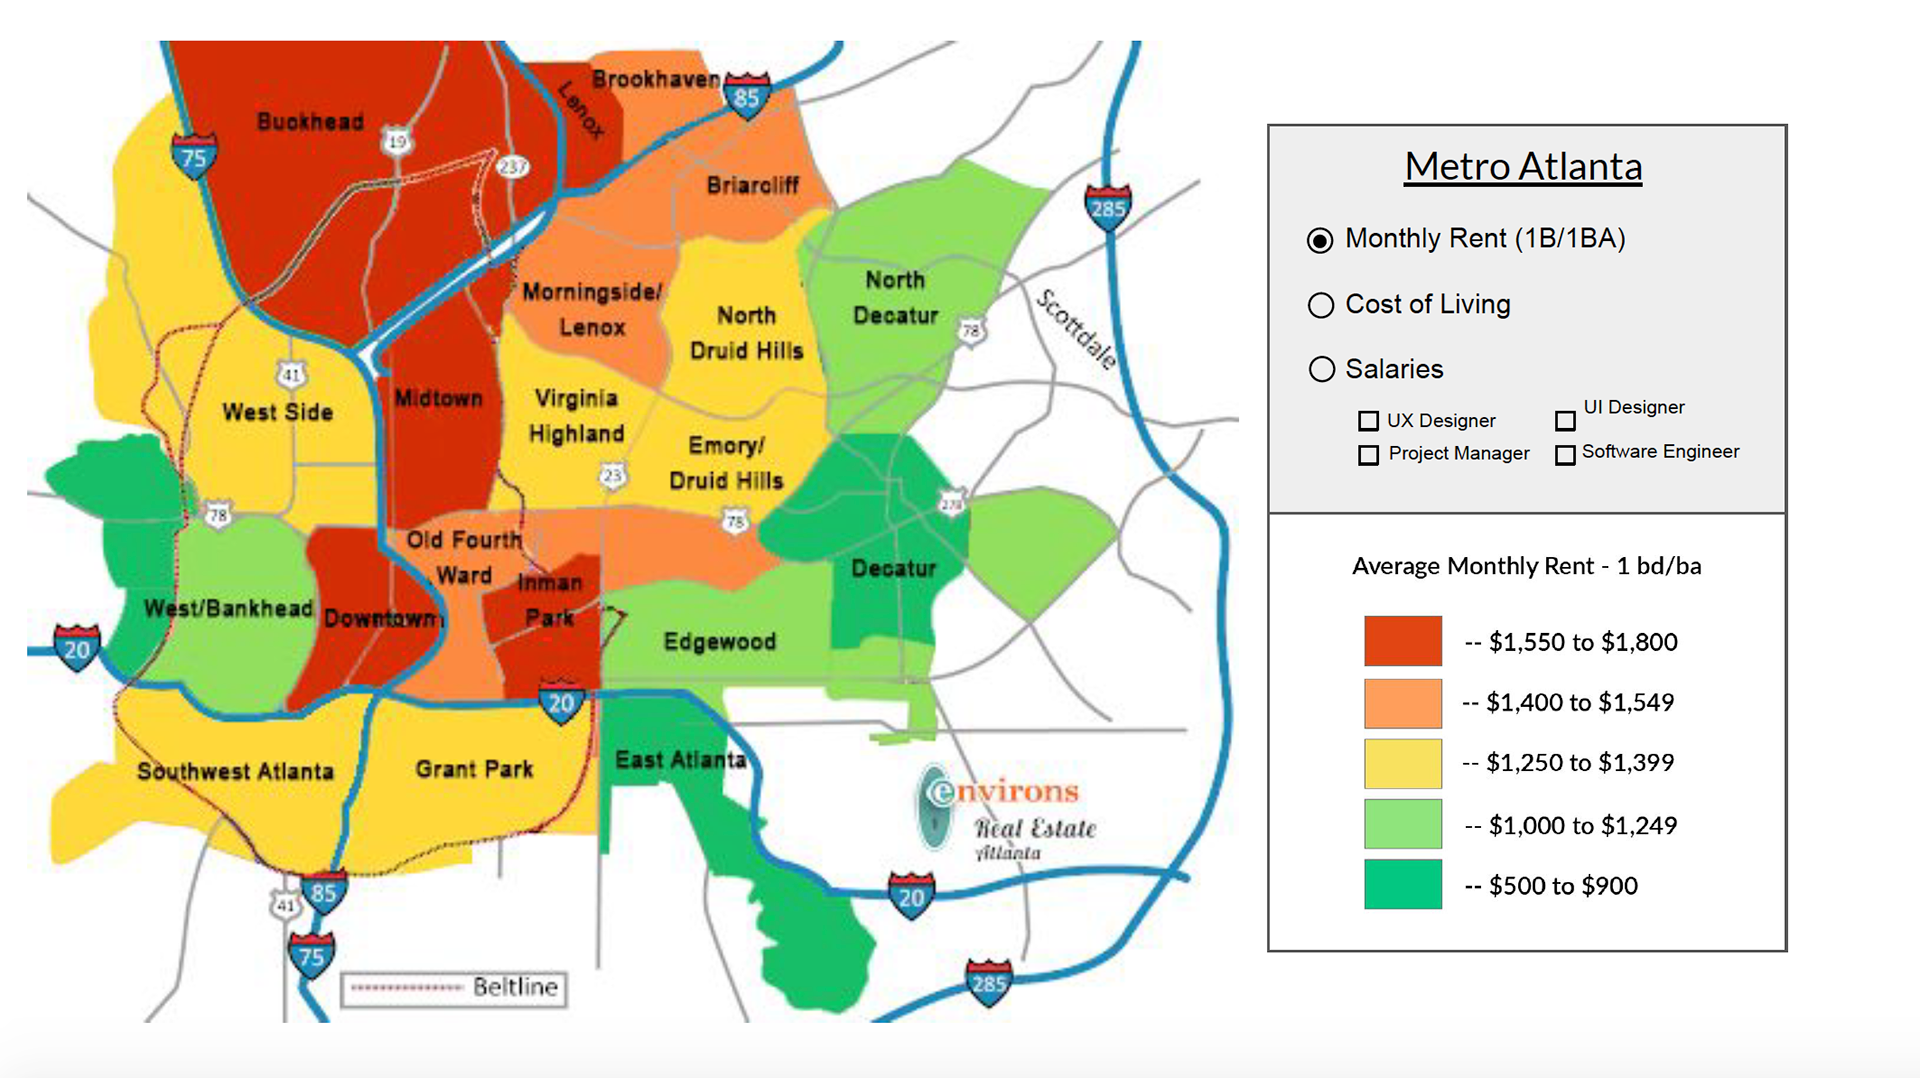
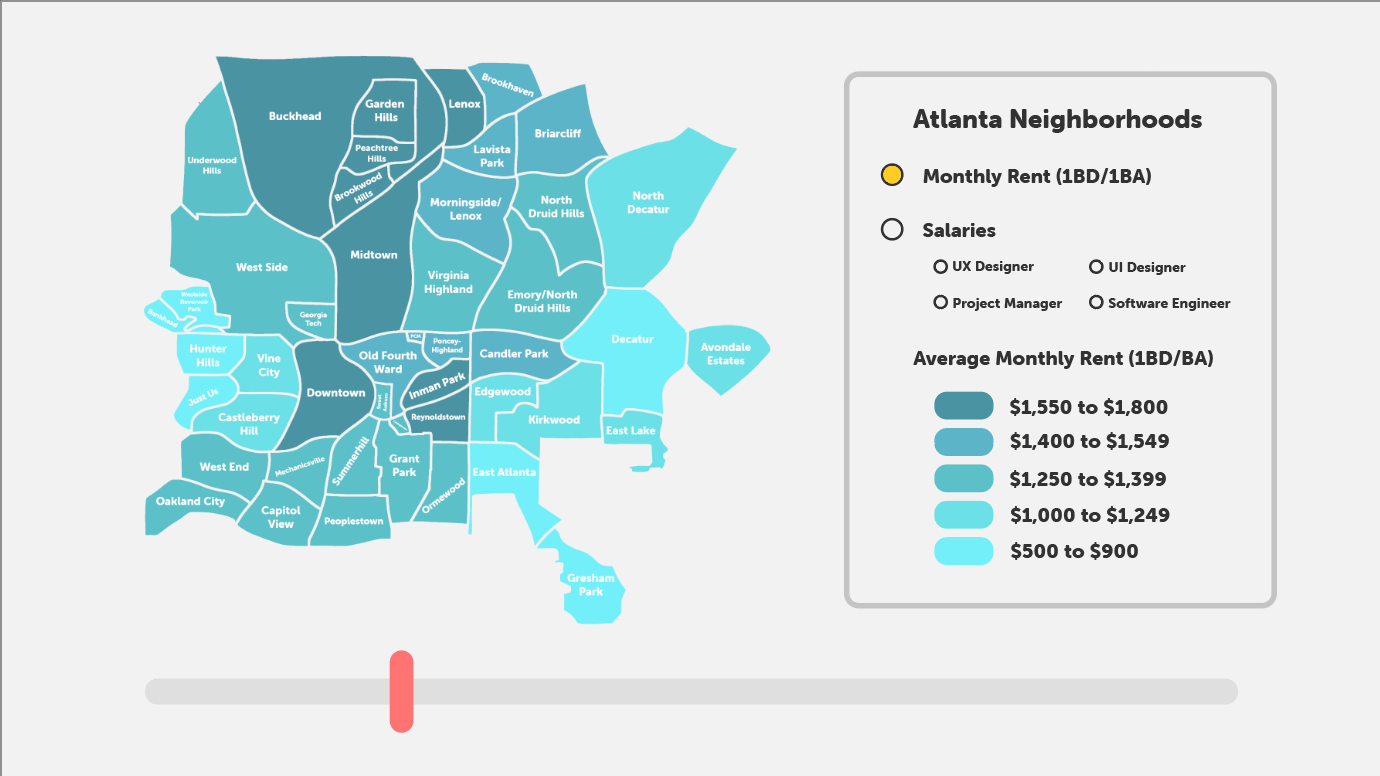
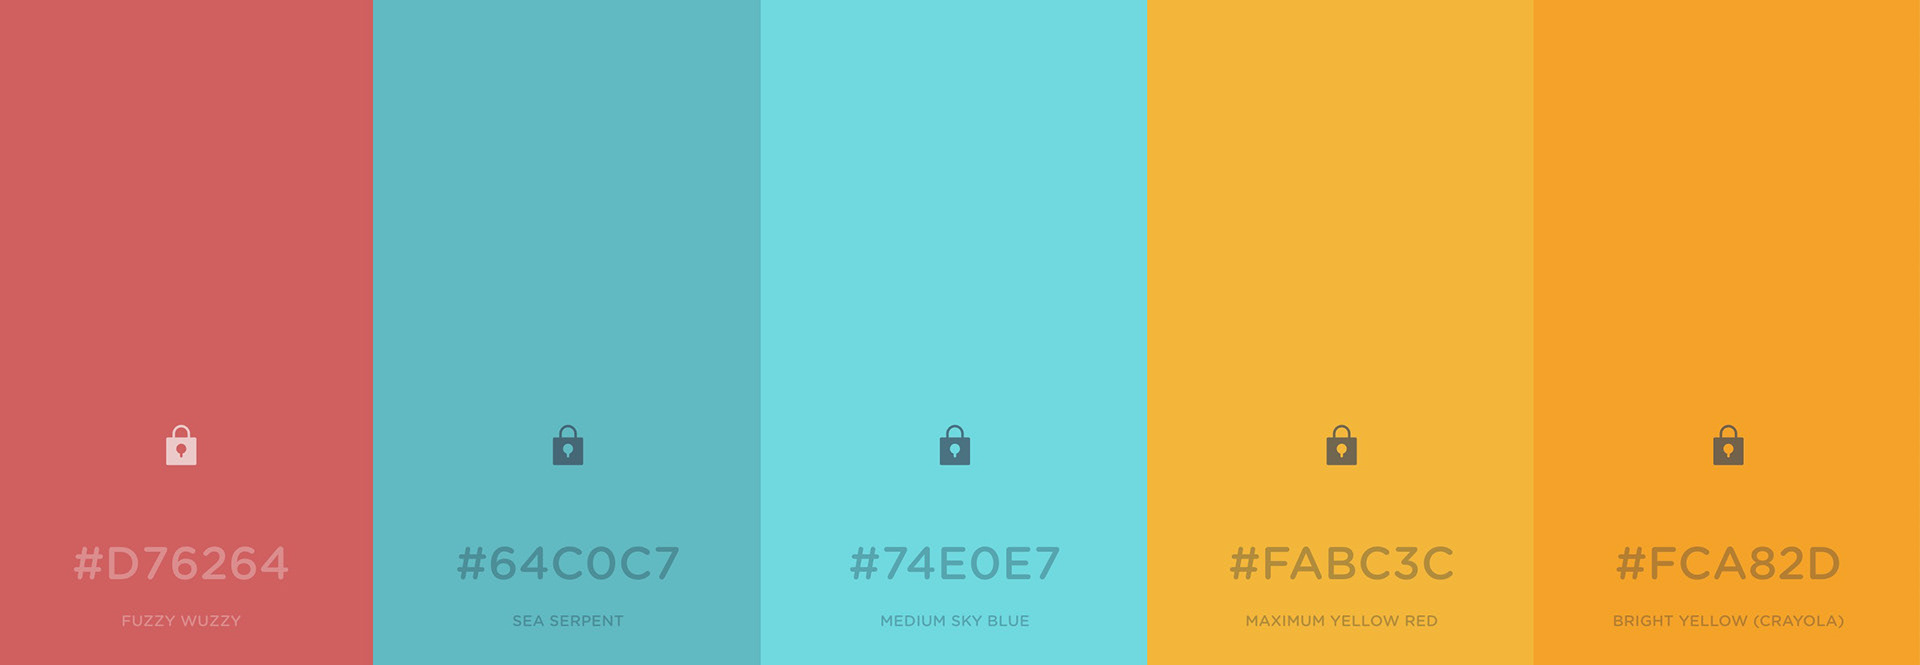
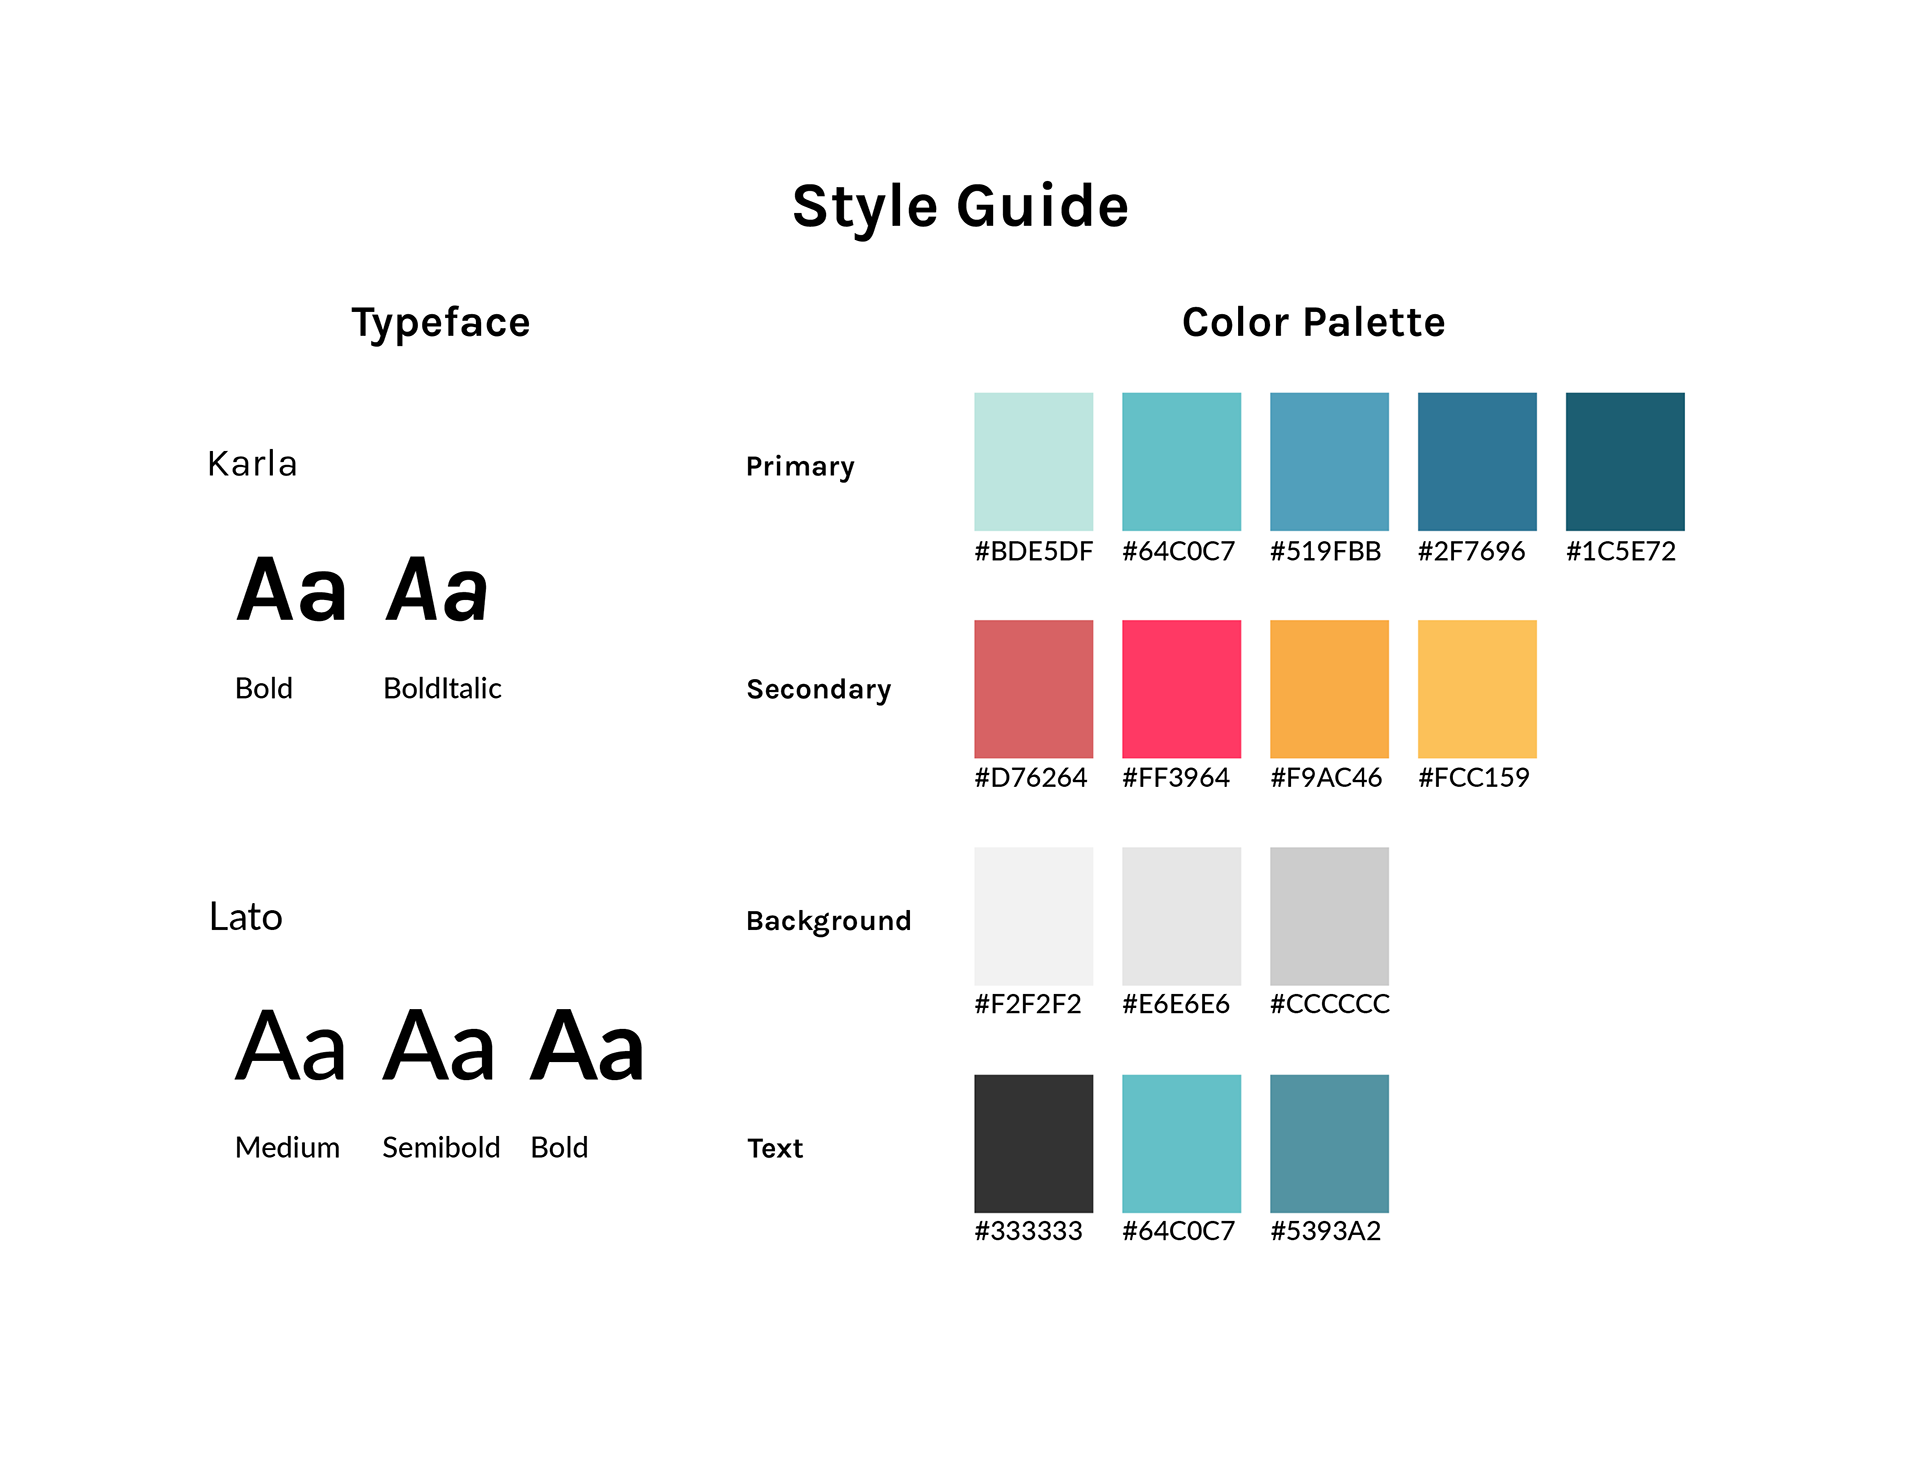
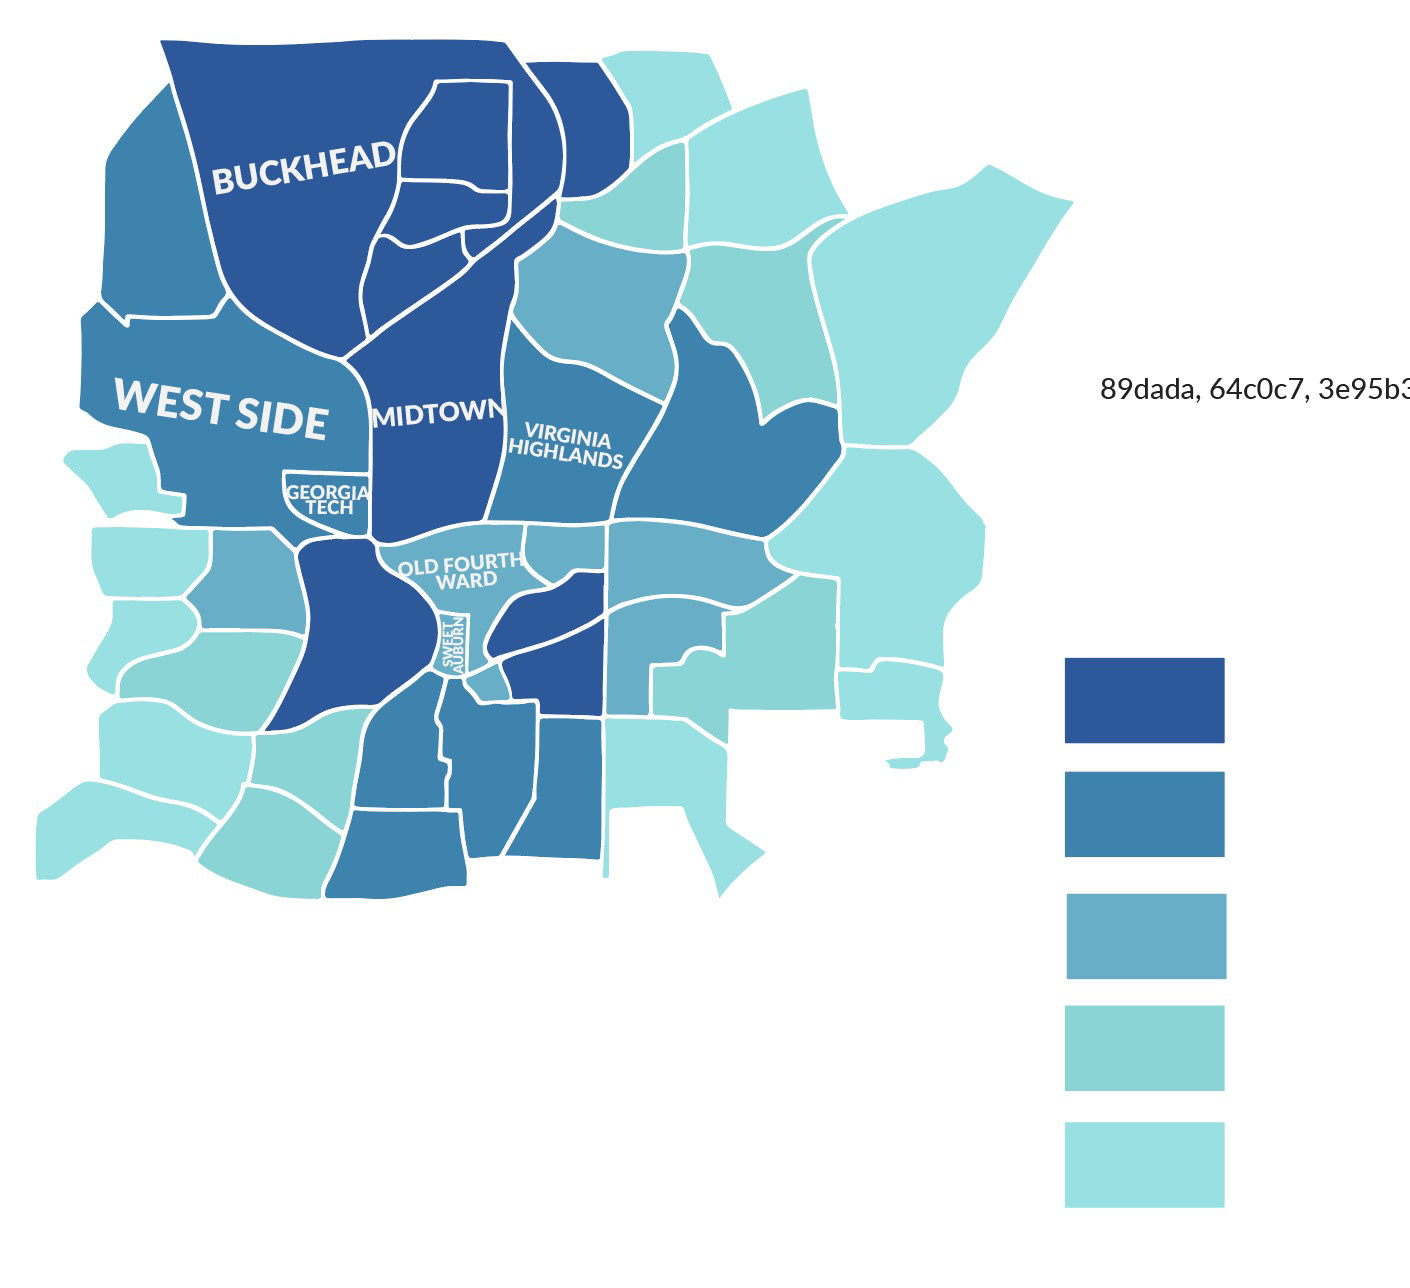
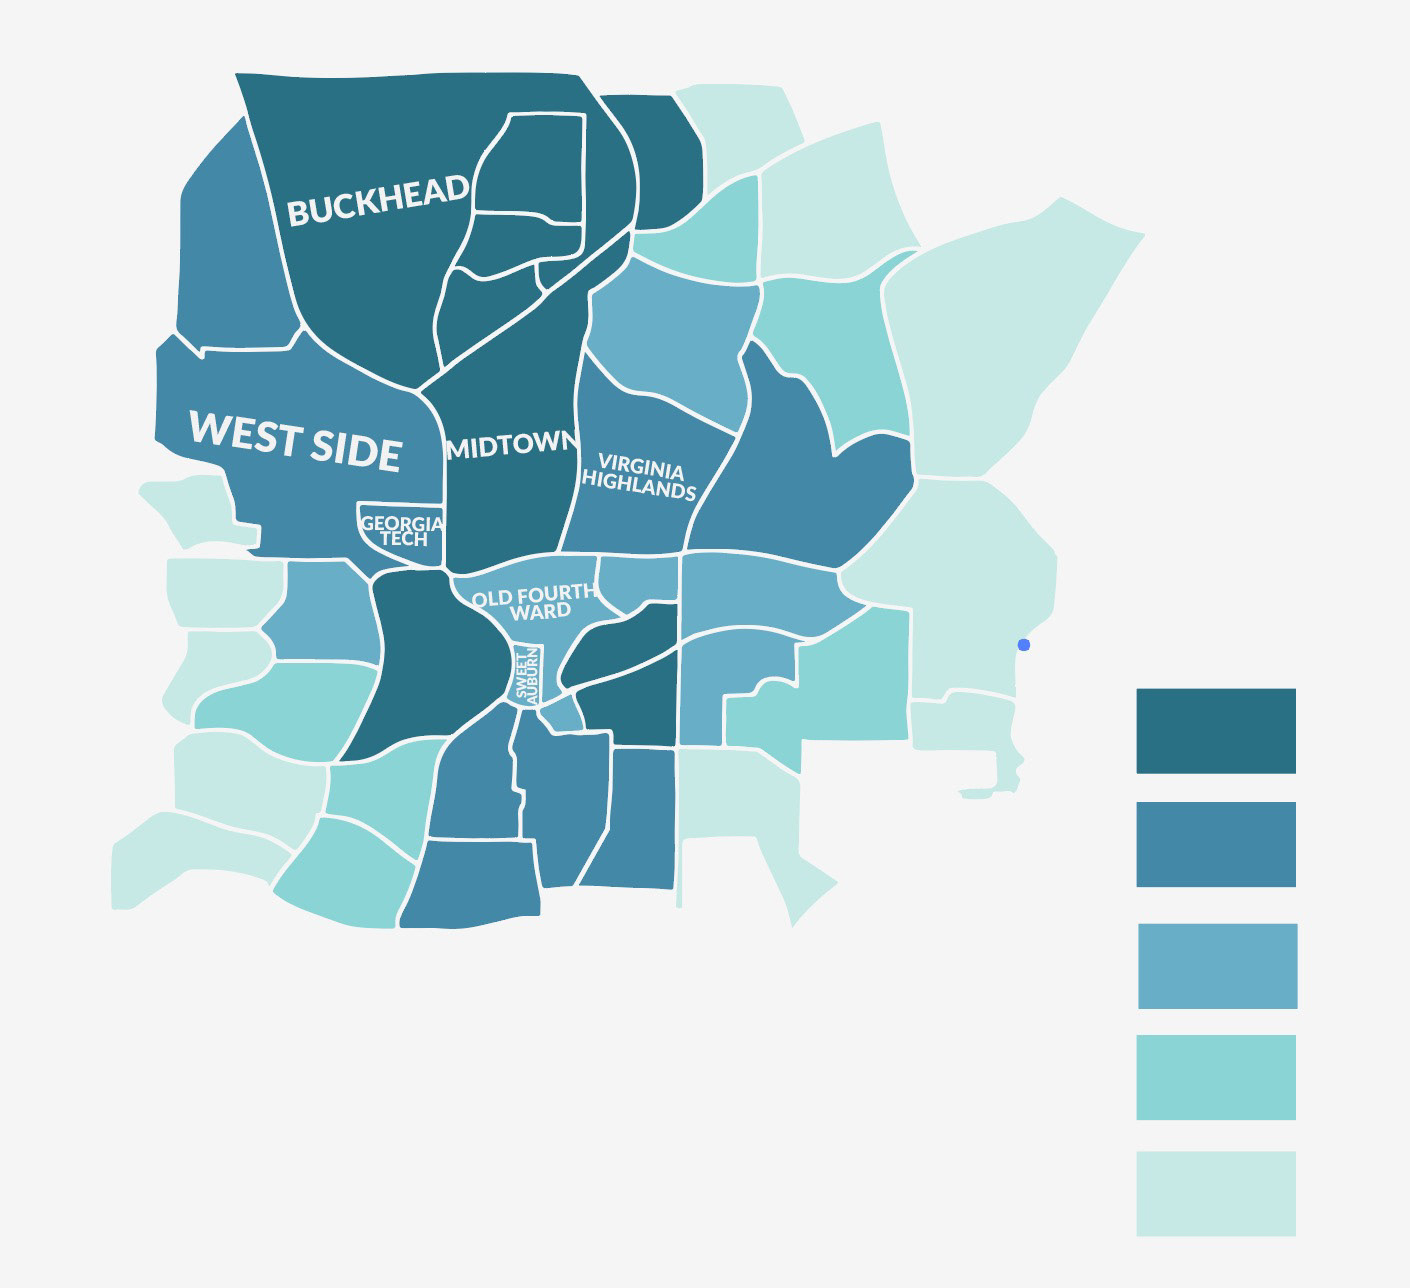
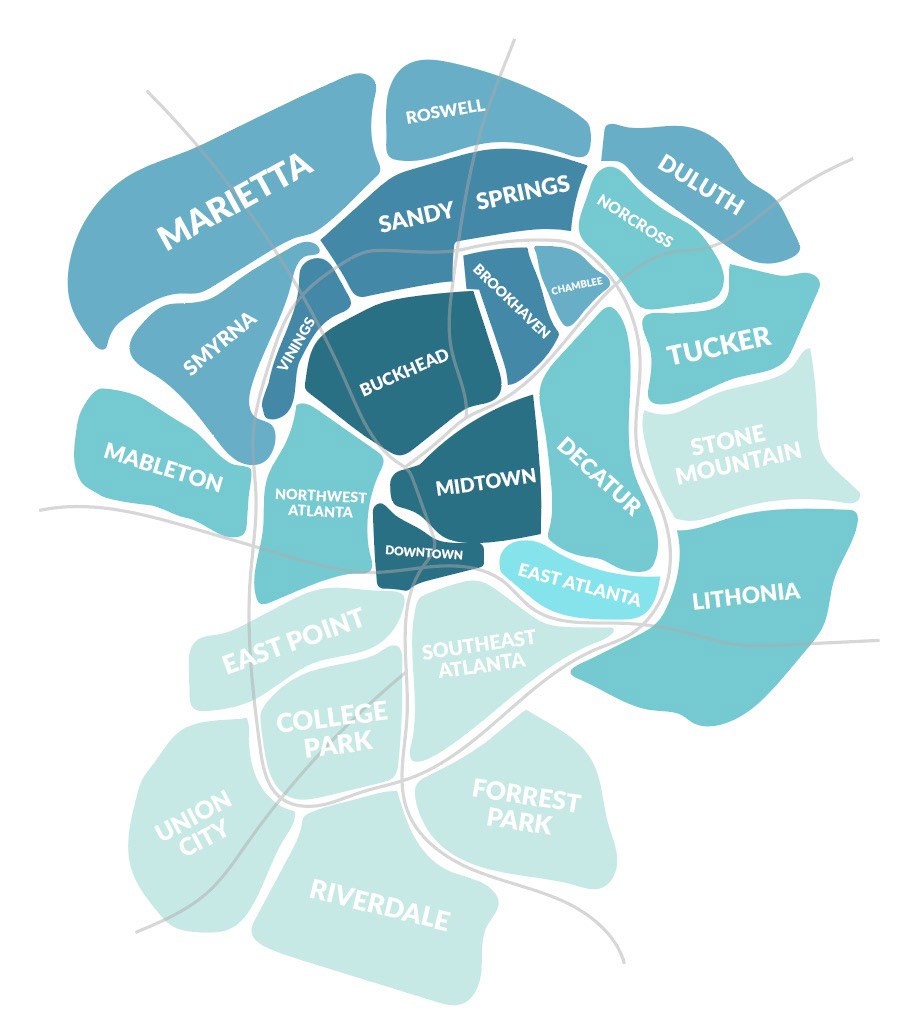
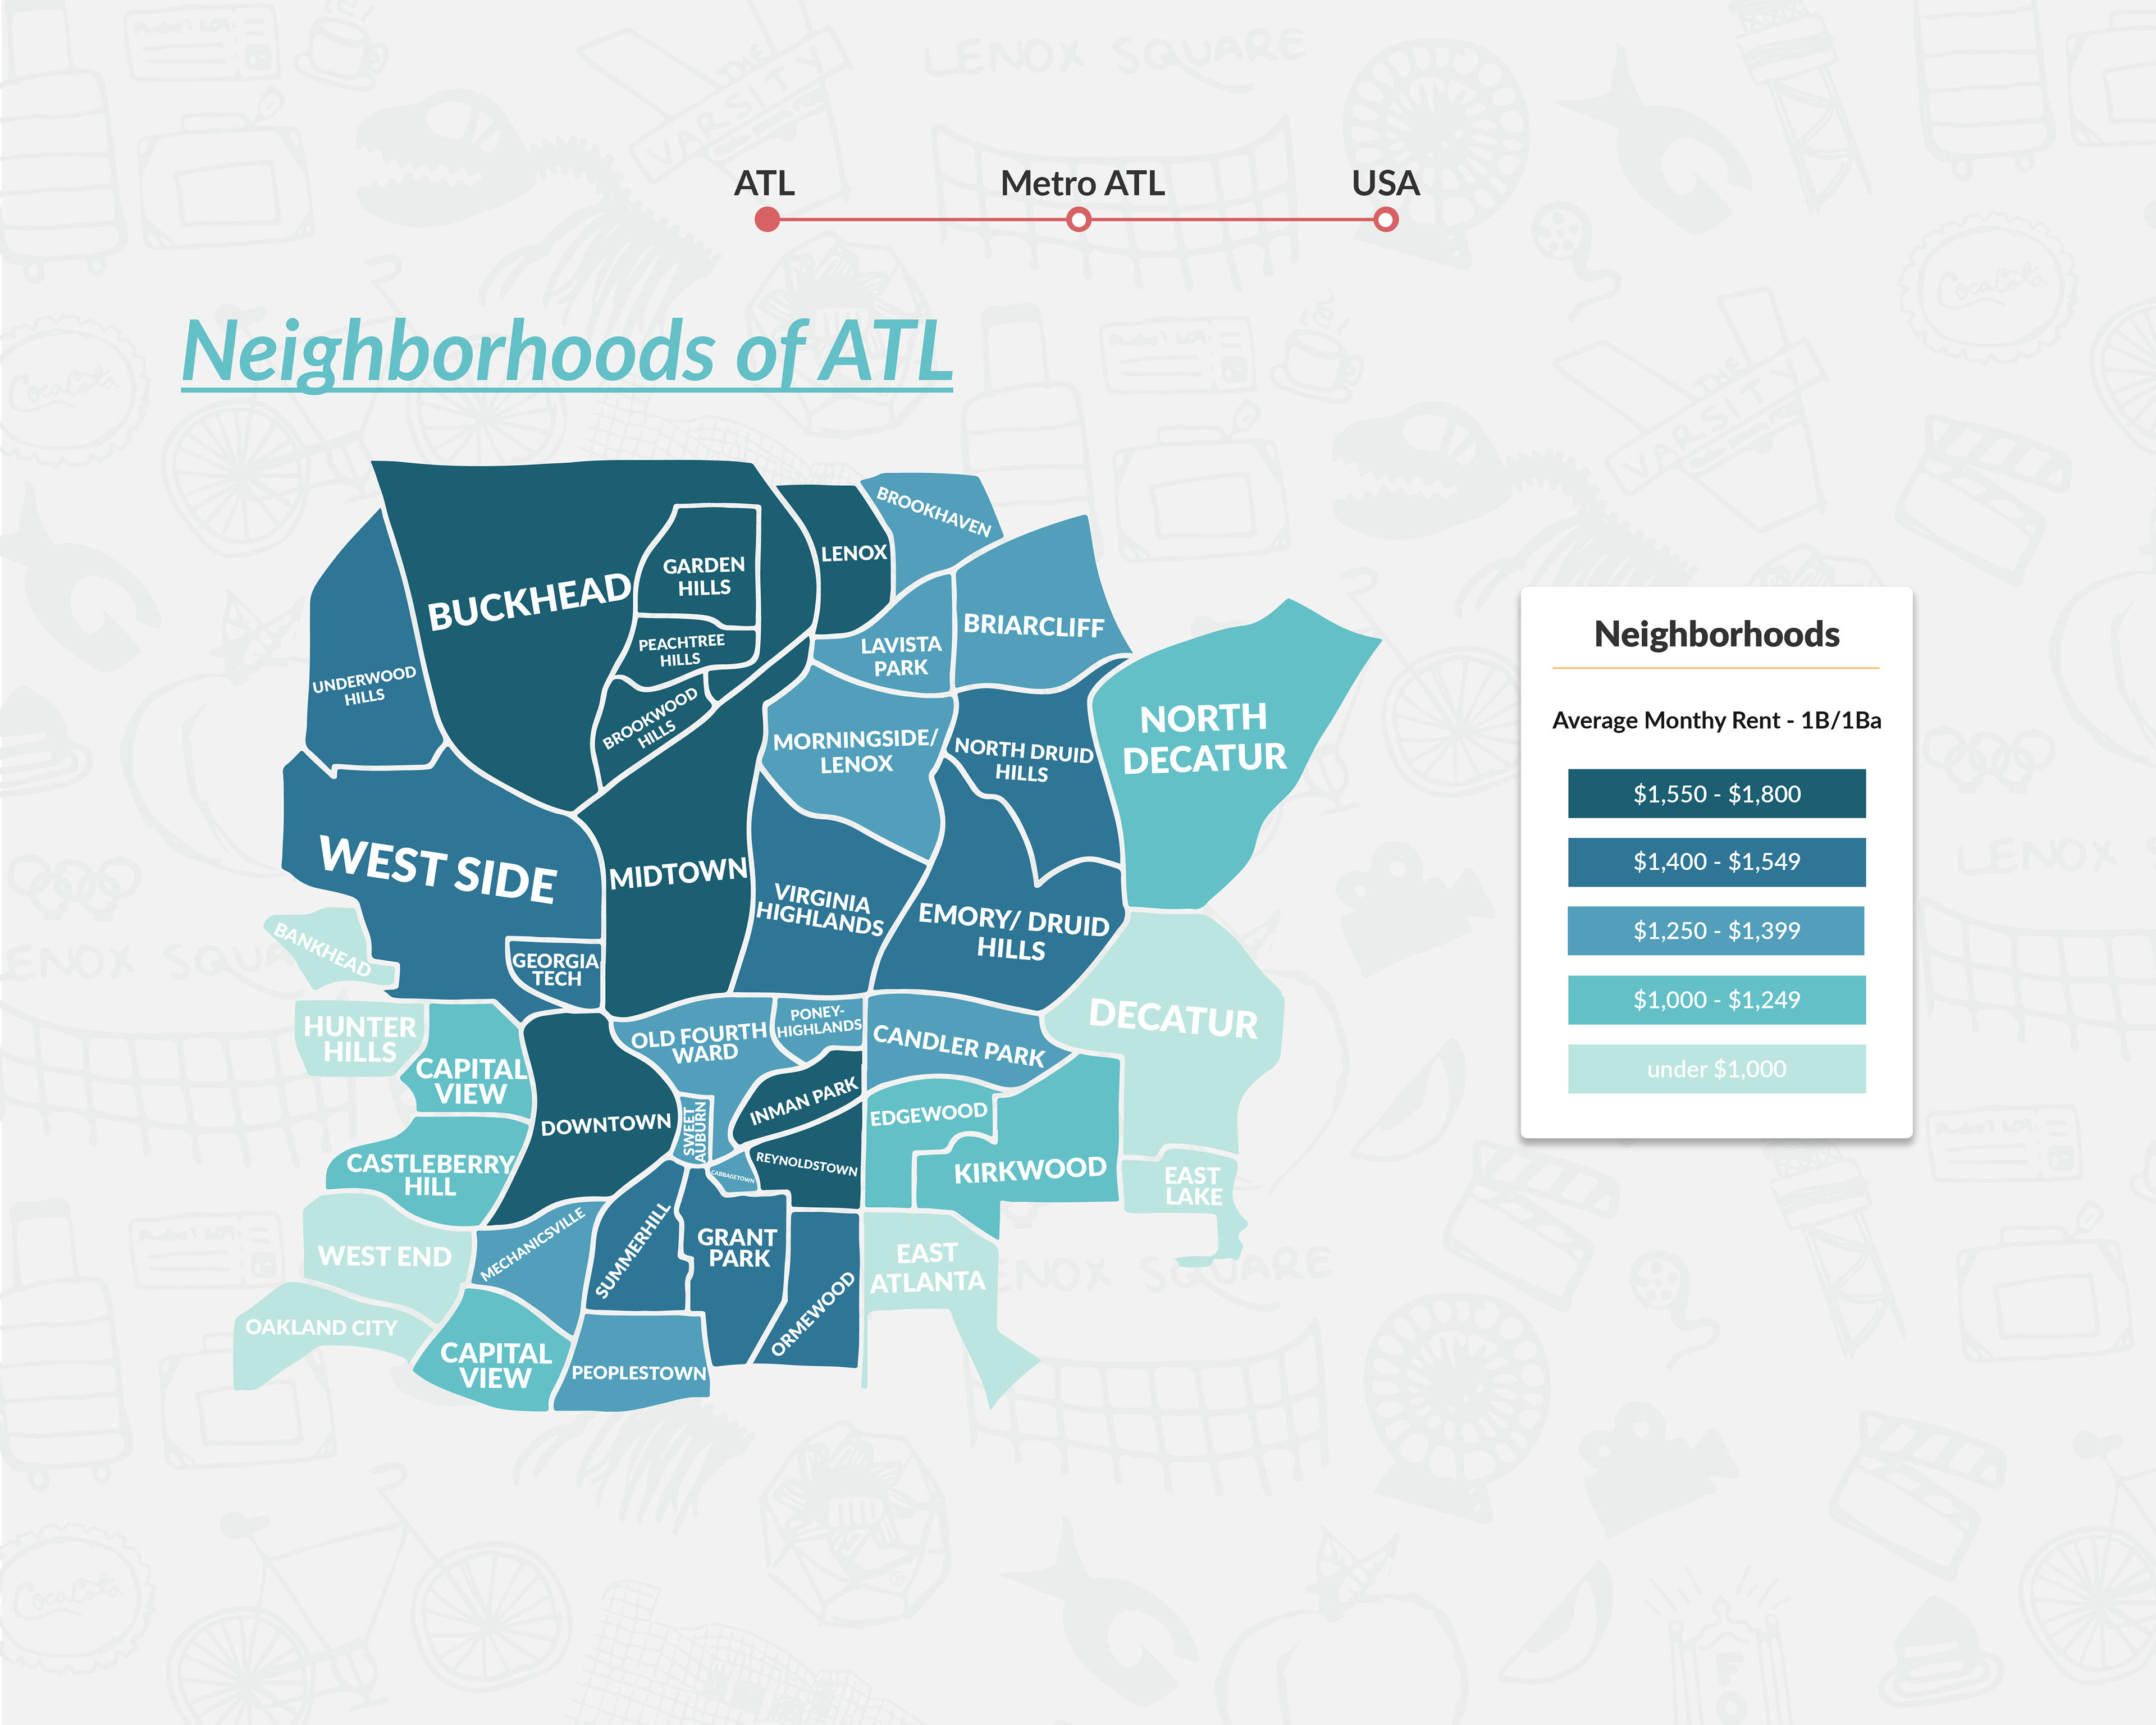
The third milestone is where we reconsidered our color palette and typography and implemented a grid layout. In terms of changing our color palette, we wanted to stray from the typical colors used in a heat map (e.g. red, orange, yellow, green) and move towards a monochromatic theme. For typography, we decided on Karla and Lato because they are simple sans-serif typefaces that work as headers and content.
map, color, and placement iterations
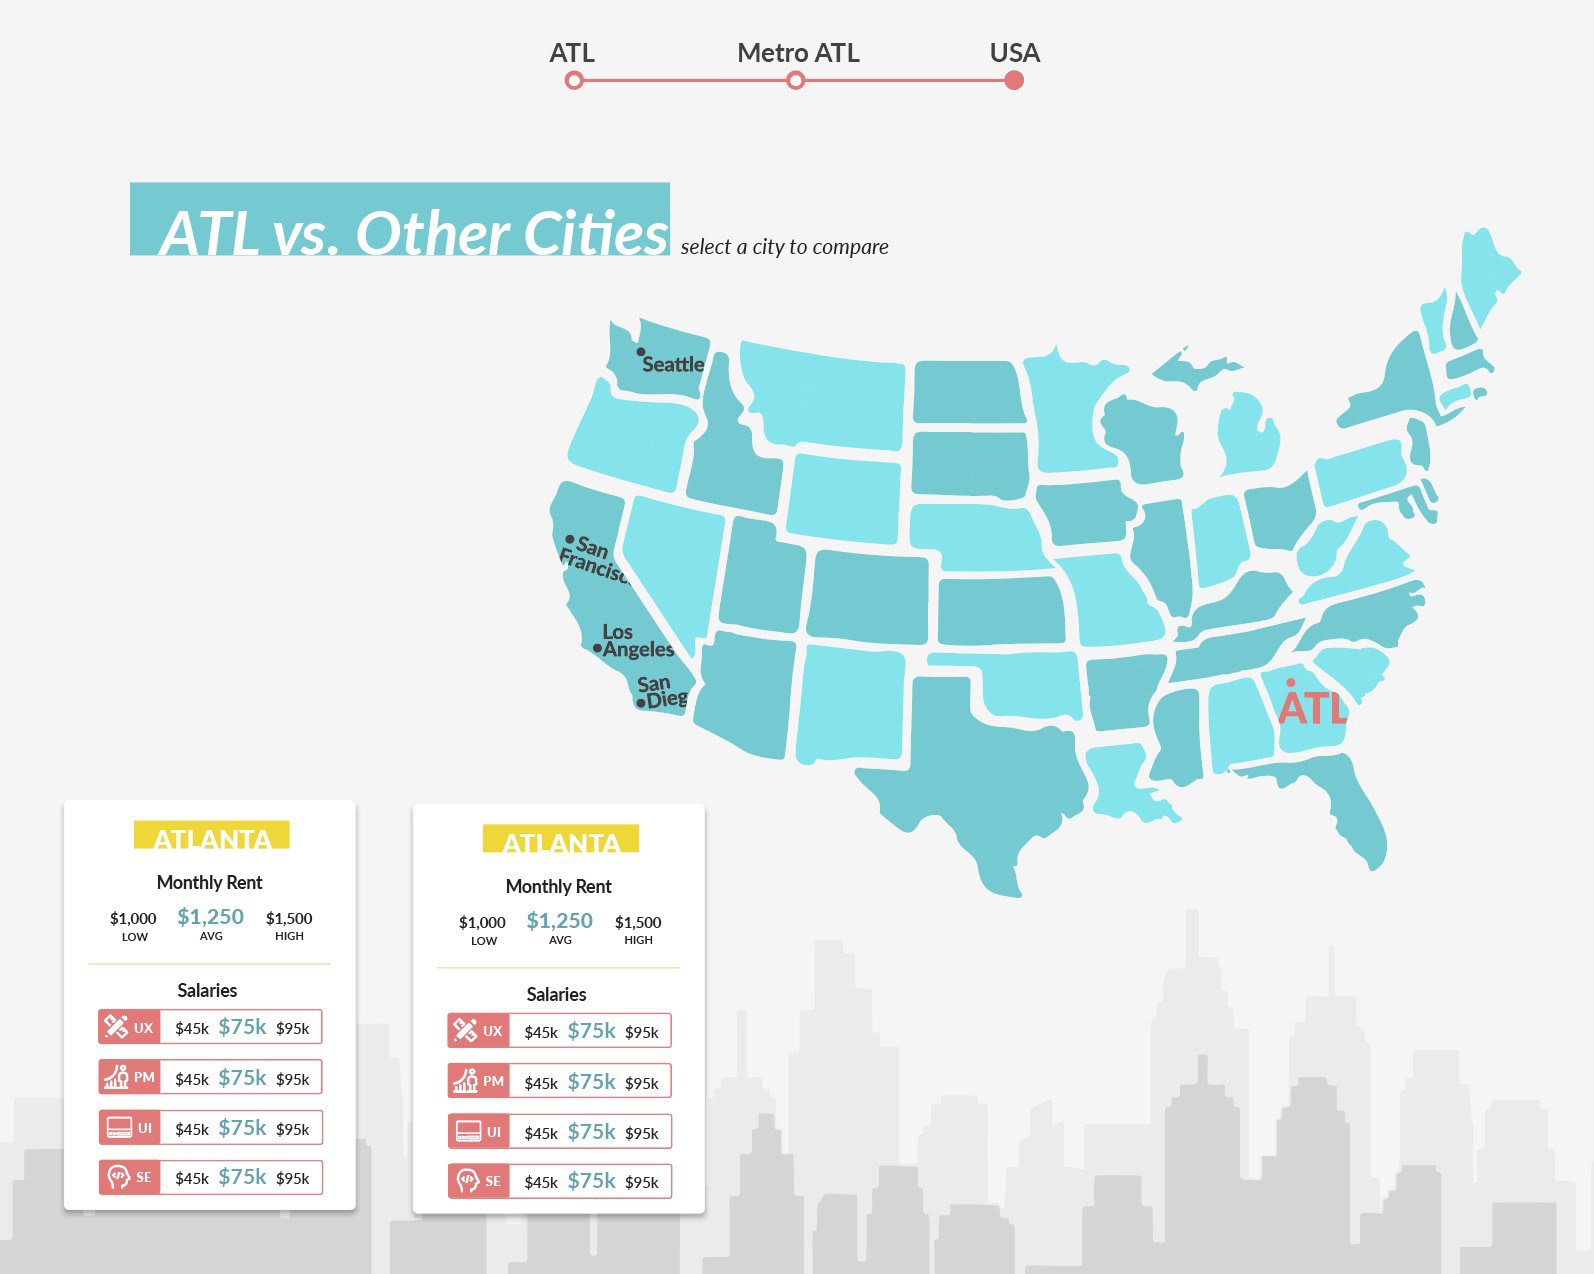
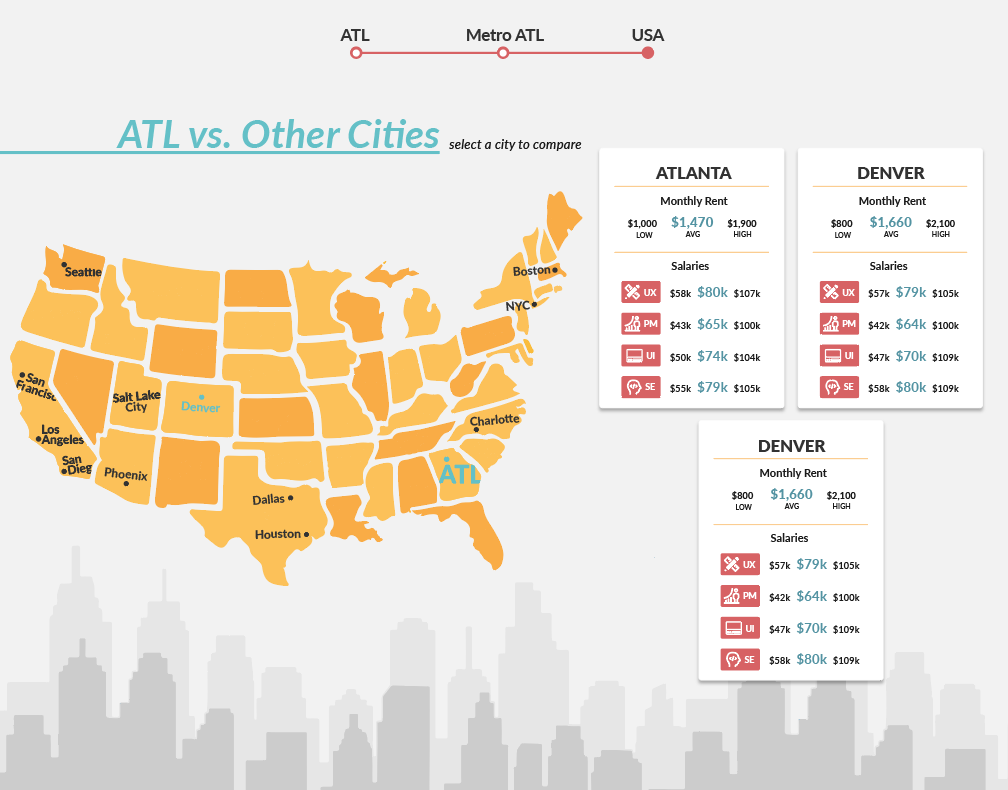
milestone 4: first interactive prototype
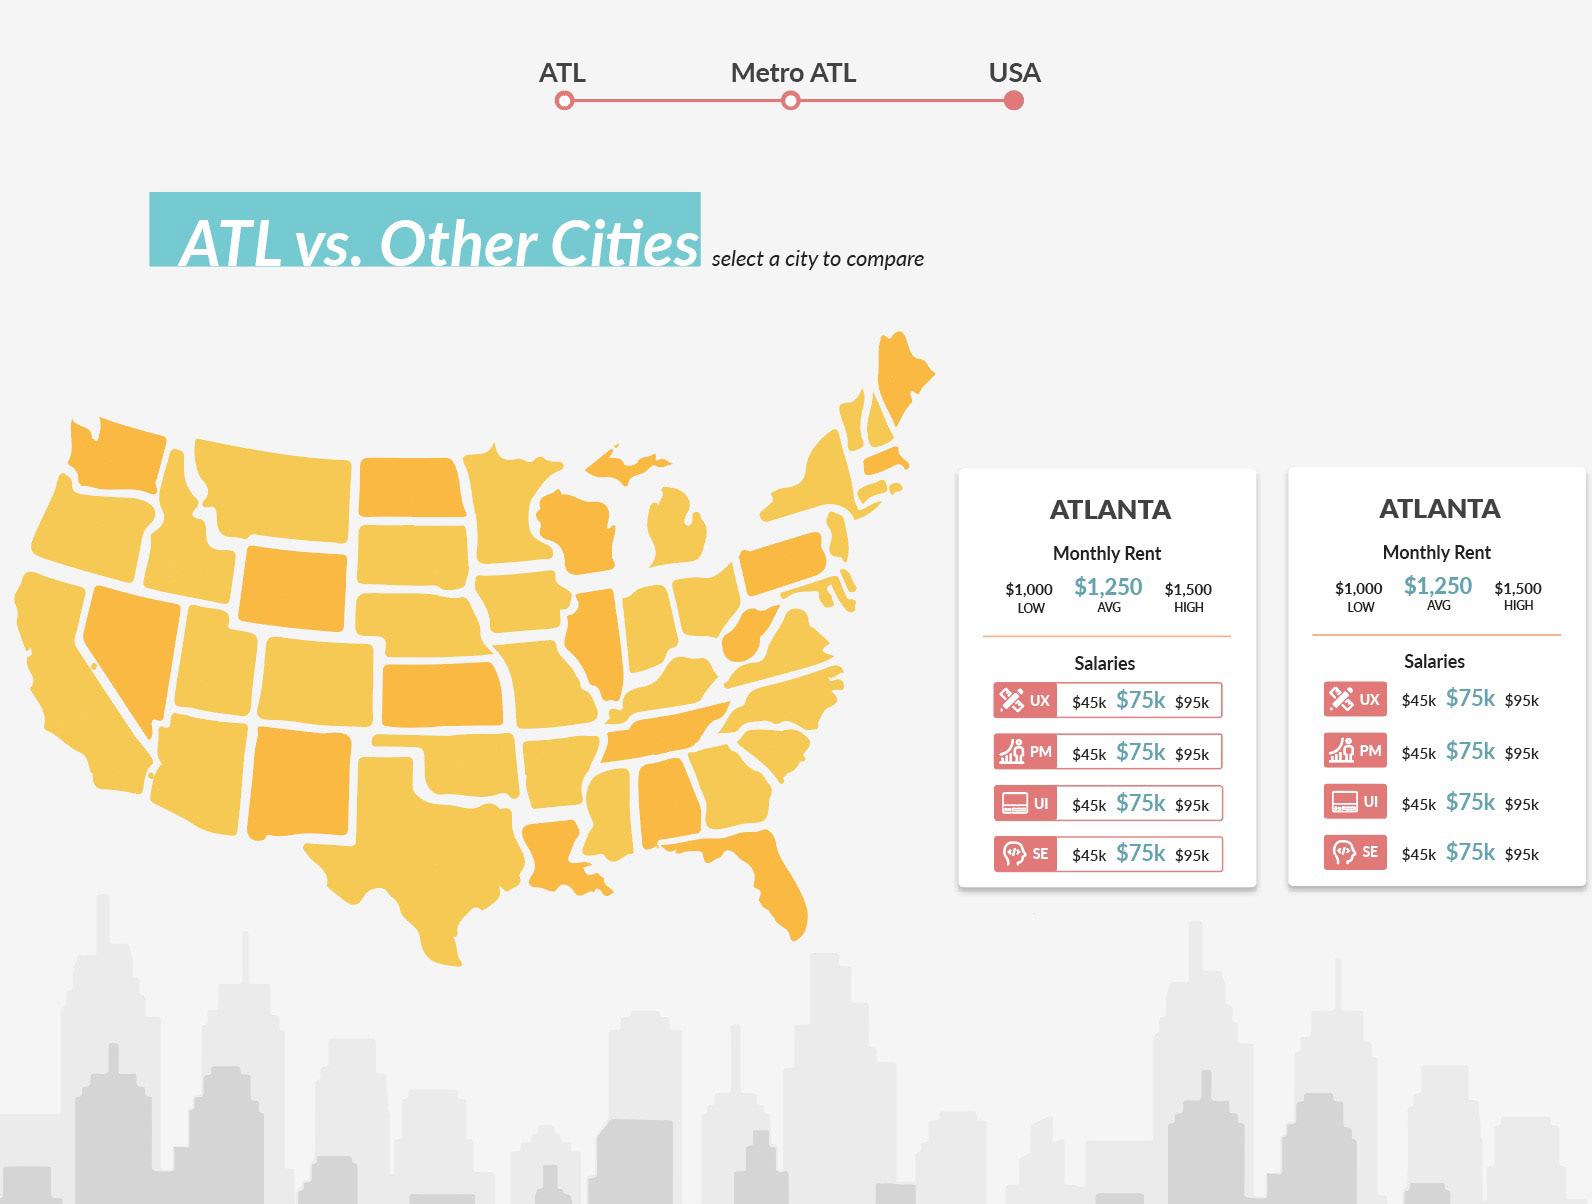
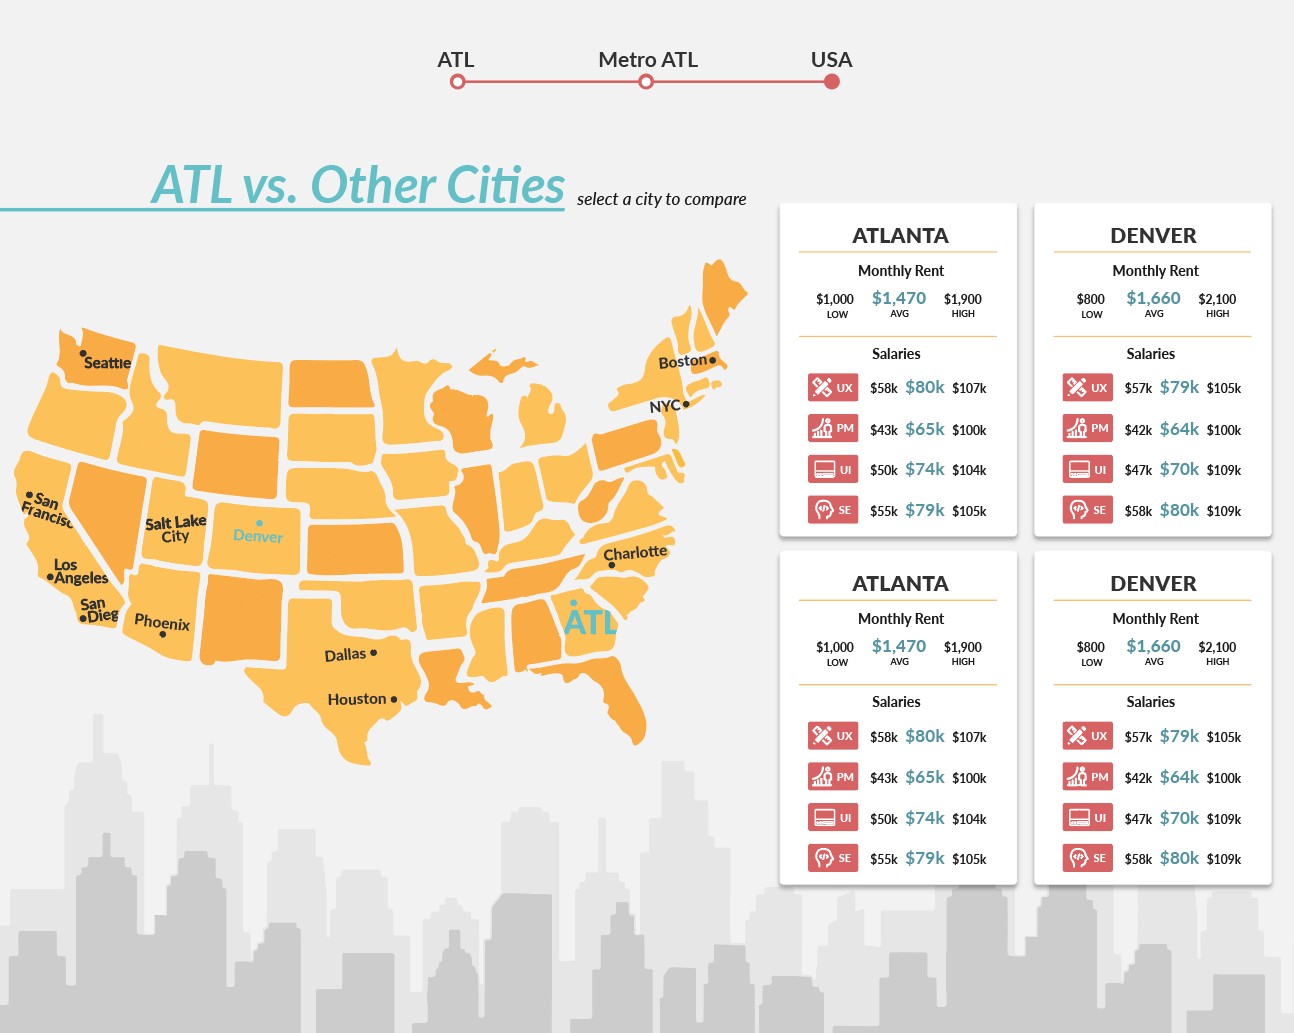
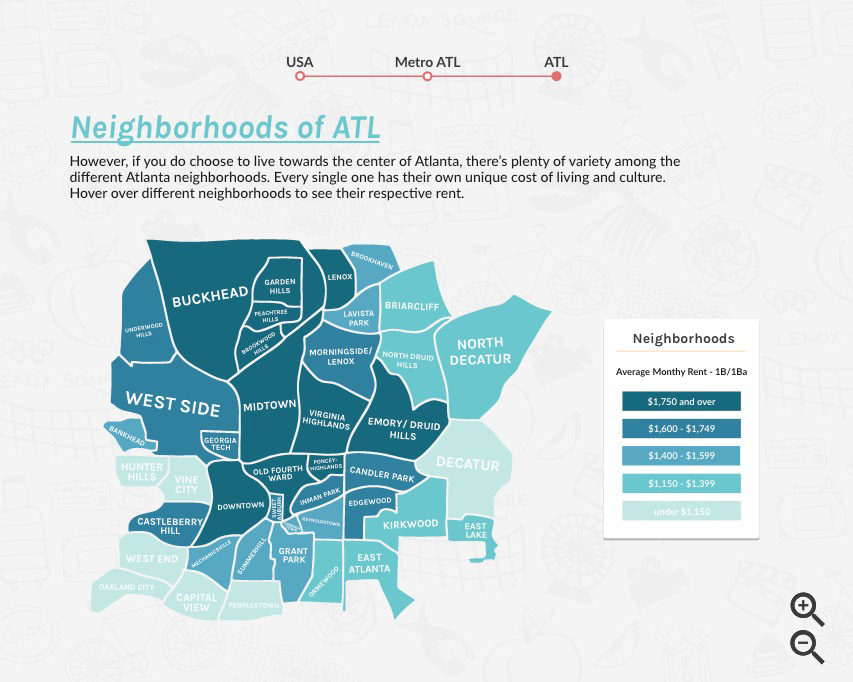
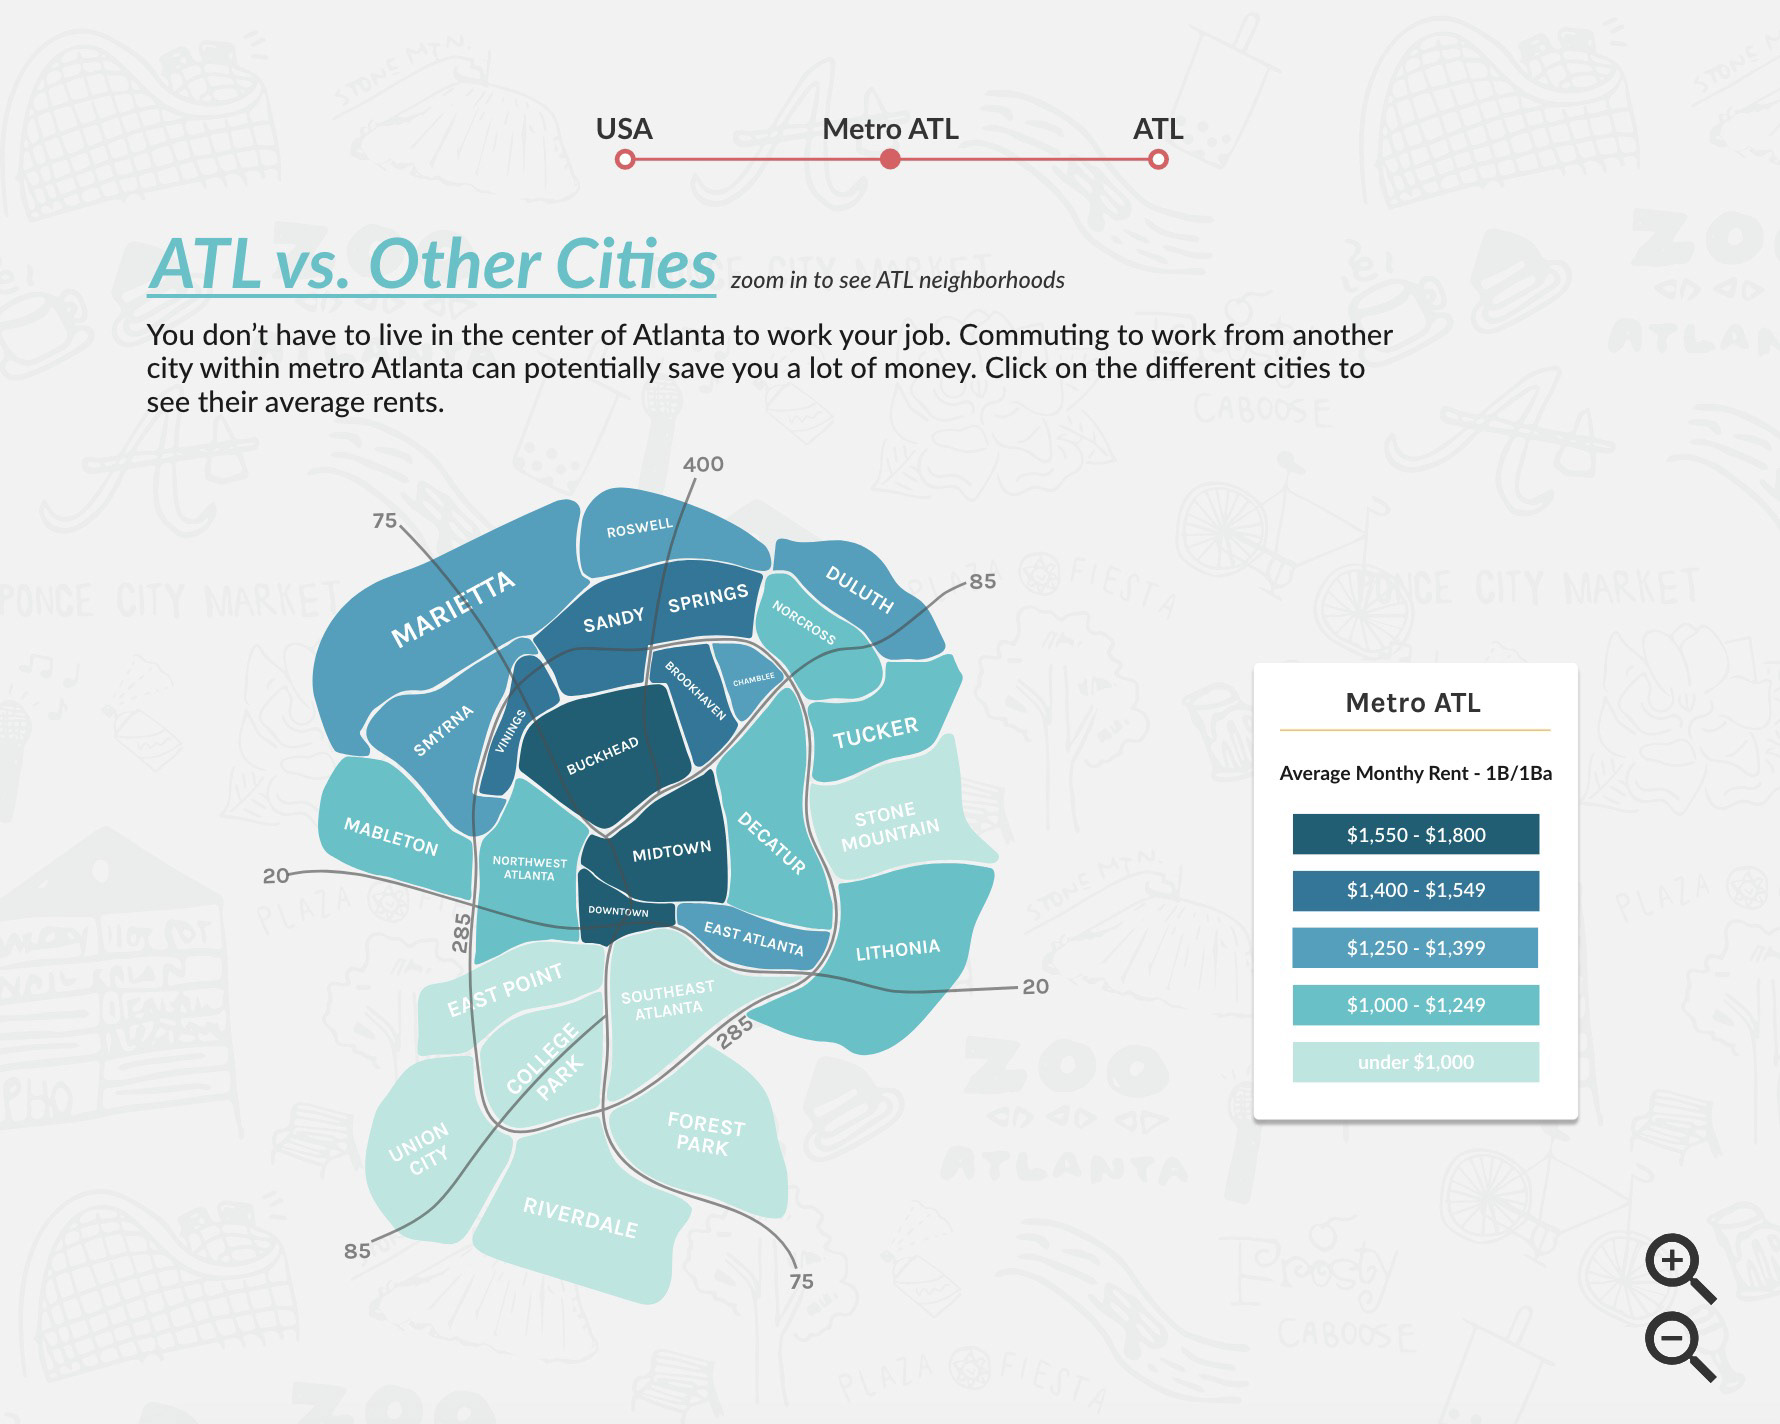
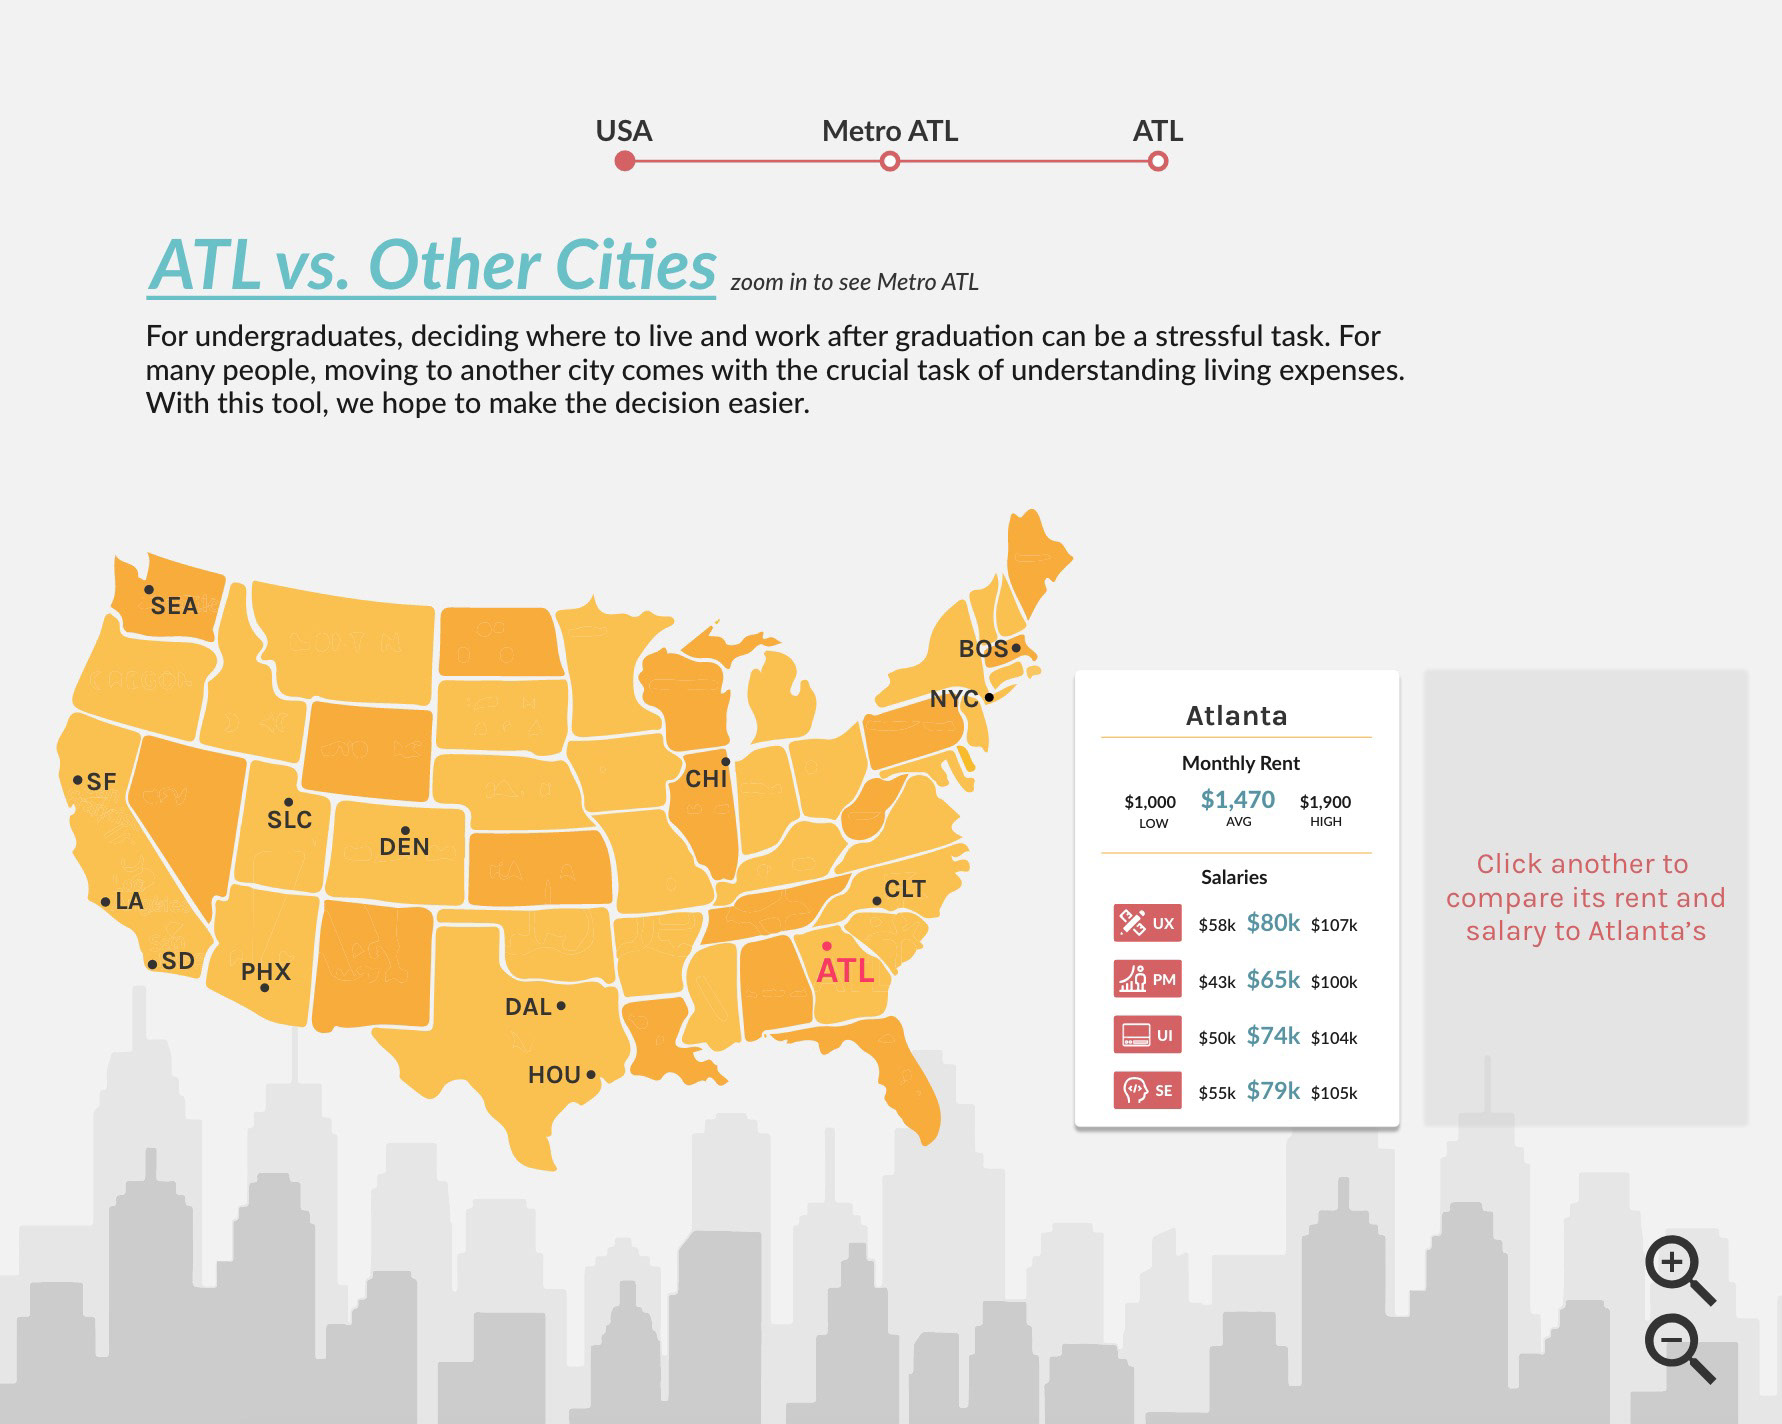
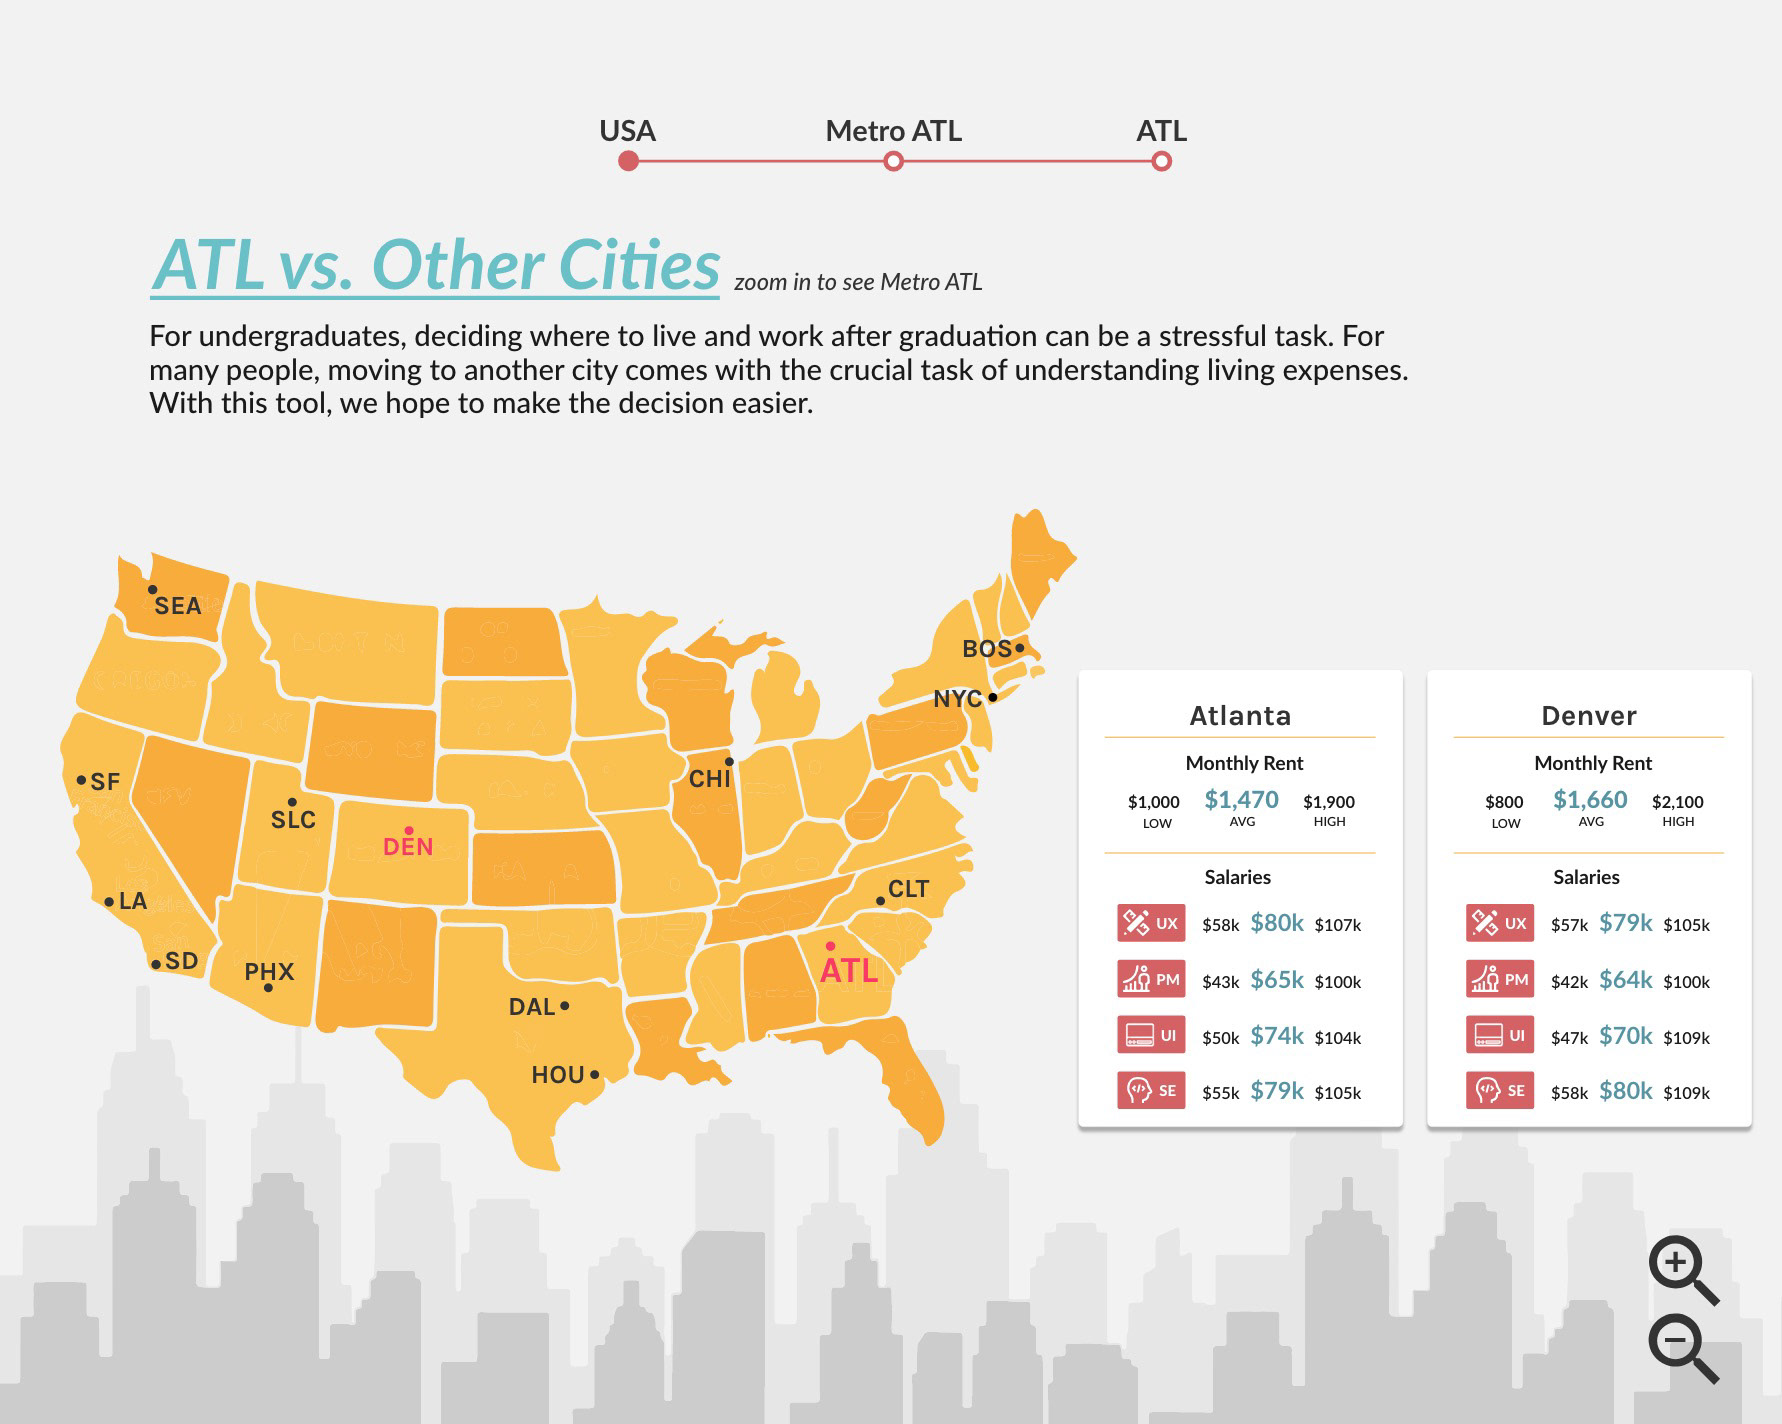
After settling on final designs of each view visually, we needed to alter the prototype in a way that all the screens would be interactive as opposed to only the first screen. The navigation bar at the top was not very intuitive to zoom, so we later added magnifying glasses that fit into the schema of zooming in and out of a screen. Additionally, we added visual feedback in the form of hover functionality, such that moving the mouse over interactive objects changes the color of the object. We also added imagery to the background of the Atlanta screens to create dimension and so that users can associate those areas with particular icons or landmarks.
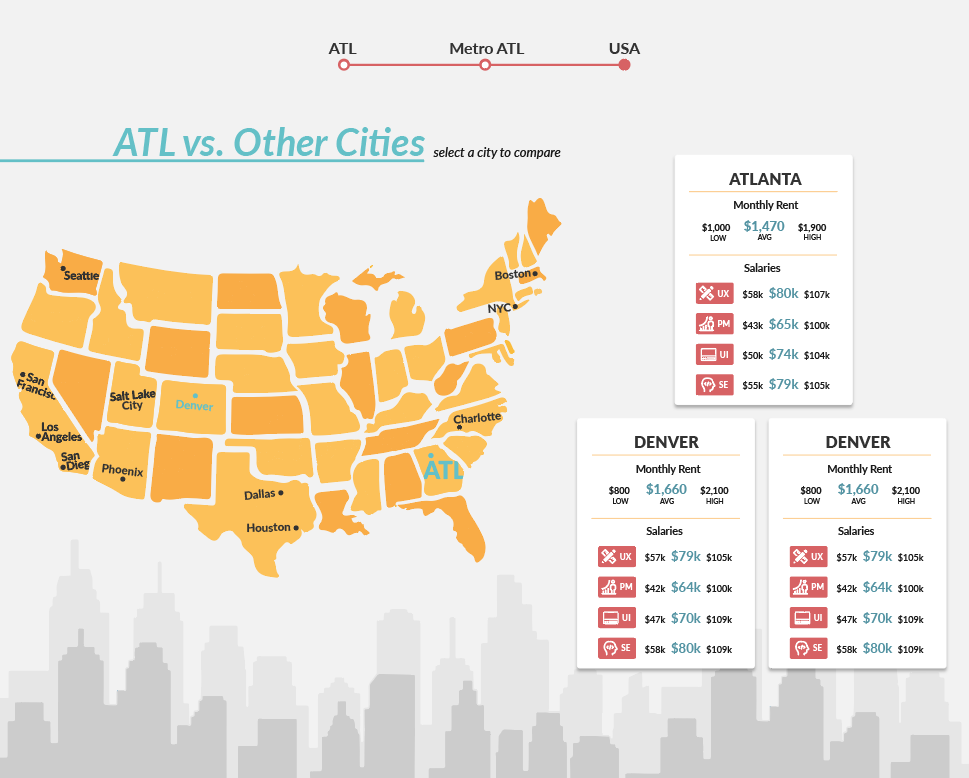
final prototype
Our final prototype is a tool that is designed to aid undergraduate students in the Atlanta area with their job search in the digital design and computing field. The final prototype functions similarly to a map with zooming functionality and includes clickable elements that can showcase statistical data based on the specific geographical area.
future work
Given more time, we would have liked to add a zoom functionality for specific cities or neighborhoods to give users data on the culture of that particular area. Information such as the number of restaurants or bike lanes could be another factor that could influence a user’s decision in choosing a place to live.